
Power BI is where a lot of organisations look at their numbers. Time-series data is where it struggles: sensor readings every second, machine telemetry, metrics from thousands of devices. Loading that firehose into Power BI directly means huge imports, slow refreshes and a dataset model that was never designed for it.
The usual answer is to keep the raw data in a database built for it, and give Power BI the slice a report needs. Arc is that kind of database: it ingests millions of records per second, stores them as Parquet, and answers analytical SQL over them. The question is how to get from Arc to Power BI without a pile of moving parts.
This post shows a path that needs none of the usual ones. No Power BI Desktop, so no Windows machine. No on-premises data gateway. No custom connector. Just Microsoft Fabric in the browser, a Python notebook of about fifteen lines, and Arc's Arrow query endpoint, which every Arc release since 25.12.1 has. We built it from a Mac.
Who this is for
- Power BI and Fabric users with time-series data: IoT and industrial telemetry, sensor networks, infrastructure and application metrics, energy and fleet data. Arc keeps the full history and does the heavy aggregation; Power BI gets a clean, typed table to report on.
- Teams that already run Arc and work in a Microsoft shop. The data can stay in Arc and still reach the dashboards everyone else uses.
- Analysts on macOS or Linux, who cannot run Power BI Desktop at all. Everything here happens in the browser.
What you get
- Power BI reports on Arc data in minutes, with the column types intact: timestamps as timestamps, readings as numbers.
- Arc does the work it is good at. You choose in SQL what crosses over (a time window, a few columns, hourly averages), so Power BI handles thousands of rows rather than billions.
- Nothing to install or operate on the Arc side. The notebook is an ordinary HTTPS client with a read-only token, and it works with the Arc you already run.
- Fast reports. Power BI reads the Lakehouse table directly (Direct Lake), so report interactions never wait on a query to Arc.
Everything below was run in a fresh Fabric trial workspace against our public demo instance, which runs Arc 26.09.4 and holds weather readings for three cities. The only change on the Arc side was a new read-only token.
How it works
Arc  ──POST /api/v1/query/arrow──▶  Fabric notebook  ──▶  Lakehouse table  ──▶  Power BI report
       (Arrow, over HTTPS)          (scheduled)          (Delta, OneLake)      (Direct Lake)
The notebook sends SQL to Arc and receives the result as an Arrow stream. It writes that to a Lakehouse table, Power BI reads the table directly (Direct Lake, no import step), and a schedule keeps it fresh.
It's a copy, not a live connection: the report shows Arc's data as of the last run. For most dashboards an hourly or fifteen-minute refresh is plenty, and it means Power BI never queries Arc while someone is clicking around a report.
Two things to create first
A workspace on a Fabric trial or capacity (notebooks don't exist on a Power BI Pro-only workspace), and a Lakehouse inside it:
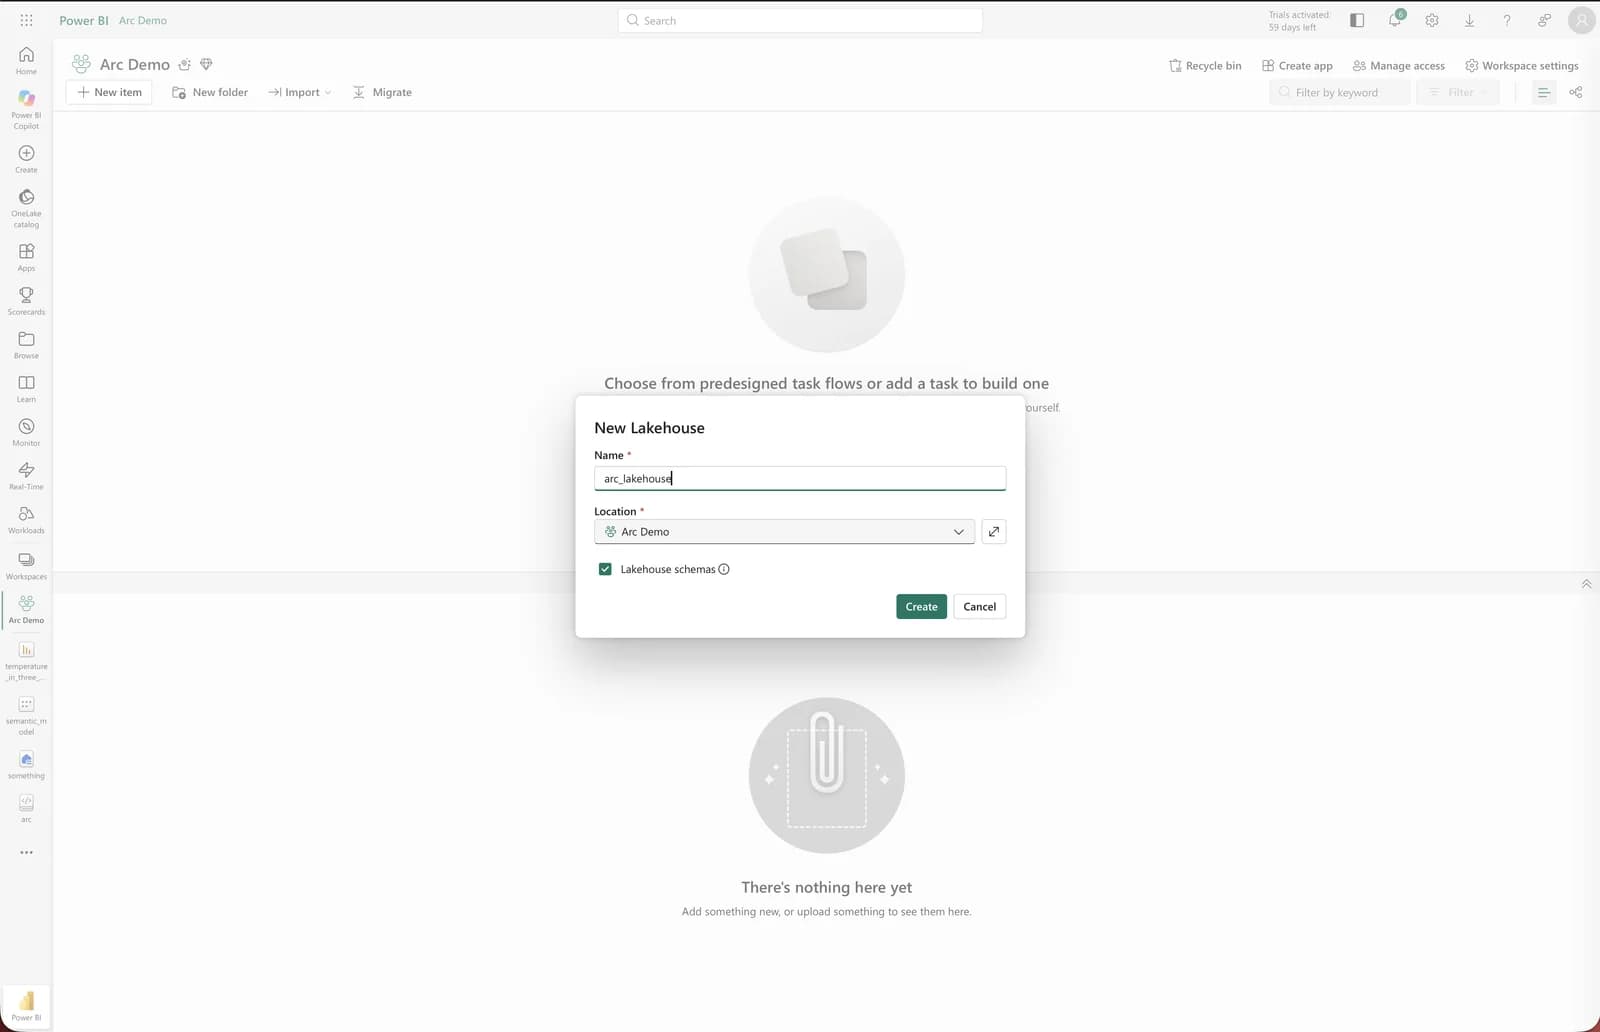
Then a notebook attached to that Lakehouse. That's all the setup there is.
Fifteen lines of Python
The token goes in its own cell, hidden, so it never ends up in a screenshot or a shared notebook. The query cell does the work:
import requests, pyarrow.ipc as ipc

ARC_URL = "https://arc.demos.basekick.net"
SQL = """
SELECT * FROM weather_tracking.weather_observations
WHERE time > now() - INTERVAL 30 DAY
"""

r = requests.post(f"{ARC_URL}/api/v1/query/arrow",
                  headers={"Authorization": f"Bearer {ARC_TOKEN}"},
                  json={"sql": SQL}, stream=True, timeout=300)
r.raise_for_status()
table = ipc.open_stream(r.raw).read_all()   # Arrow: columnar, no JSON
print(f"{table.num_rows} rows from Arc")

spark.createDataFrame(table.to_pandas()) \
     .write.mode("overwrite").saveAsTable("weather_observations")
It is ordinary Arc SQL, so you choose what crosses over: a time window, a few columns, or an aggregate instead of raw rows.
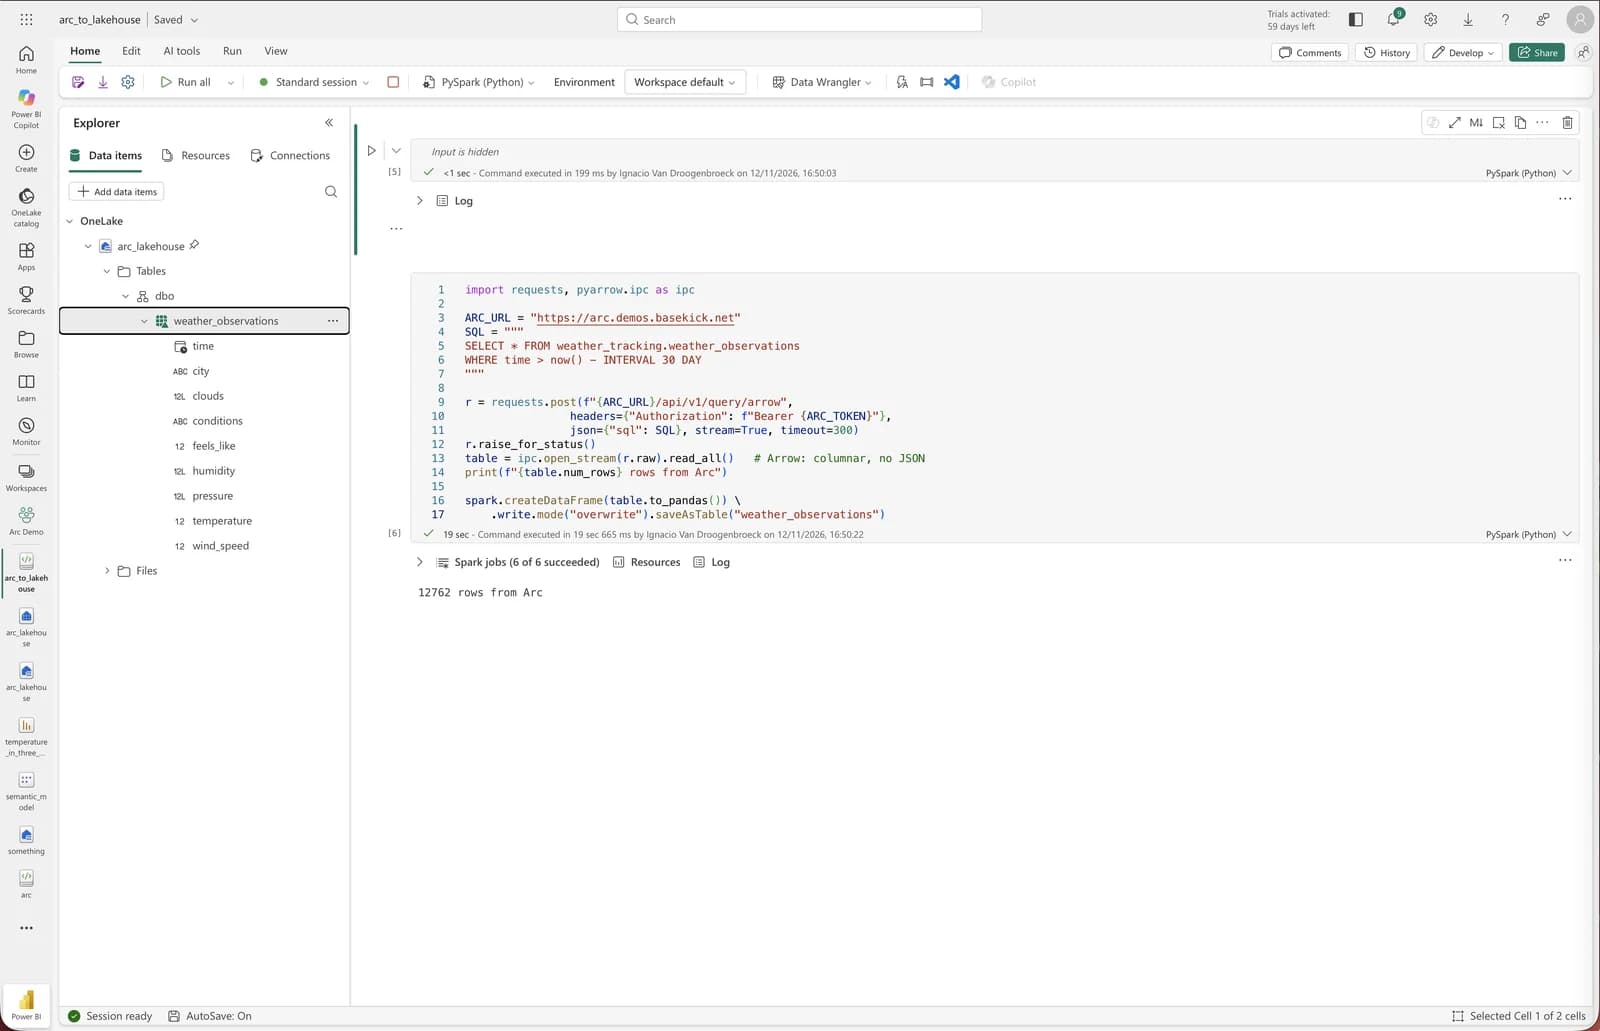
12,762 rows, thirty days of readings for three cities, and the column types arrived intact: time as a timestamp, the readings as numbers, city as text. That's the reason to use the Arrow endpoint rather than Arc's JSON one. JSON has no types, so timestamps arrive as strings to parse, and a float column whose values happen to be whole numbers comes back as integers. Arrow carries the schema with the data.
One Fabric detail that cost us a minute: the new table shows up in the Explorer only after you refresh it (dbo → ⋯ → Refresh).
From table to report
In the Lakehouse, New semantic model turns the table into something Power BI can use. Pick the table, confirm:
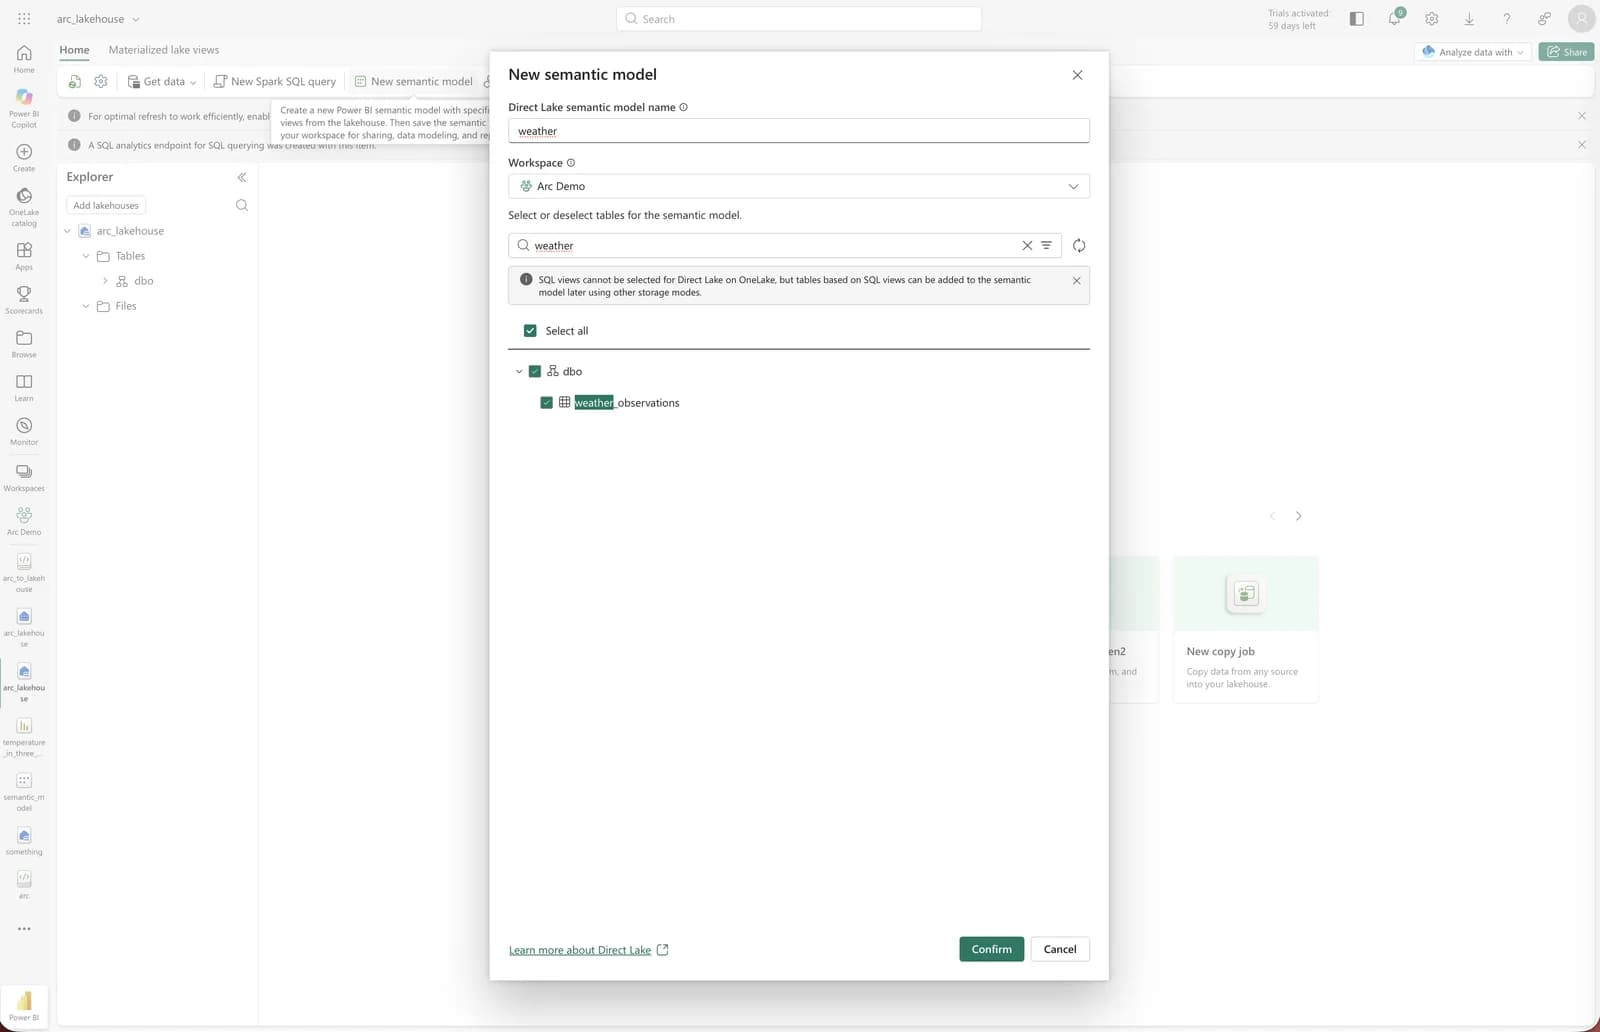
Then a report: a line chart with time on the X-axis, temperature on the Y-axis and city as the legend. Set the measure to Average: Power BI sums numbers by default, which adds up readings that share a timestamp.
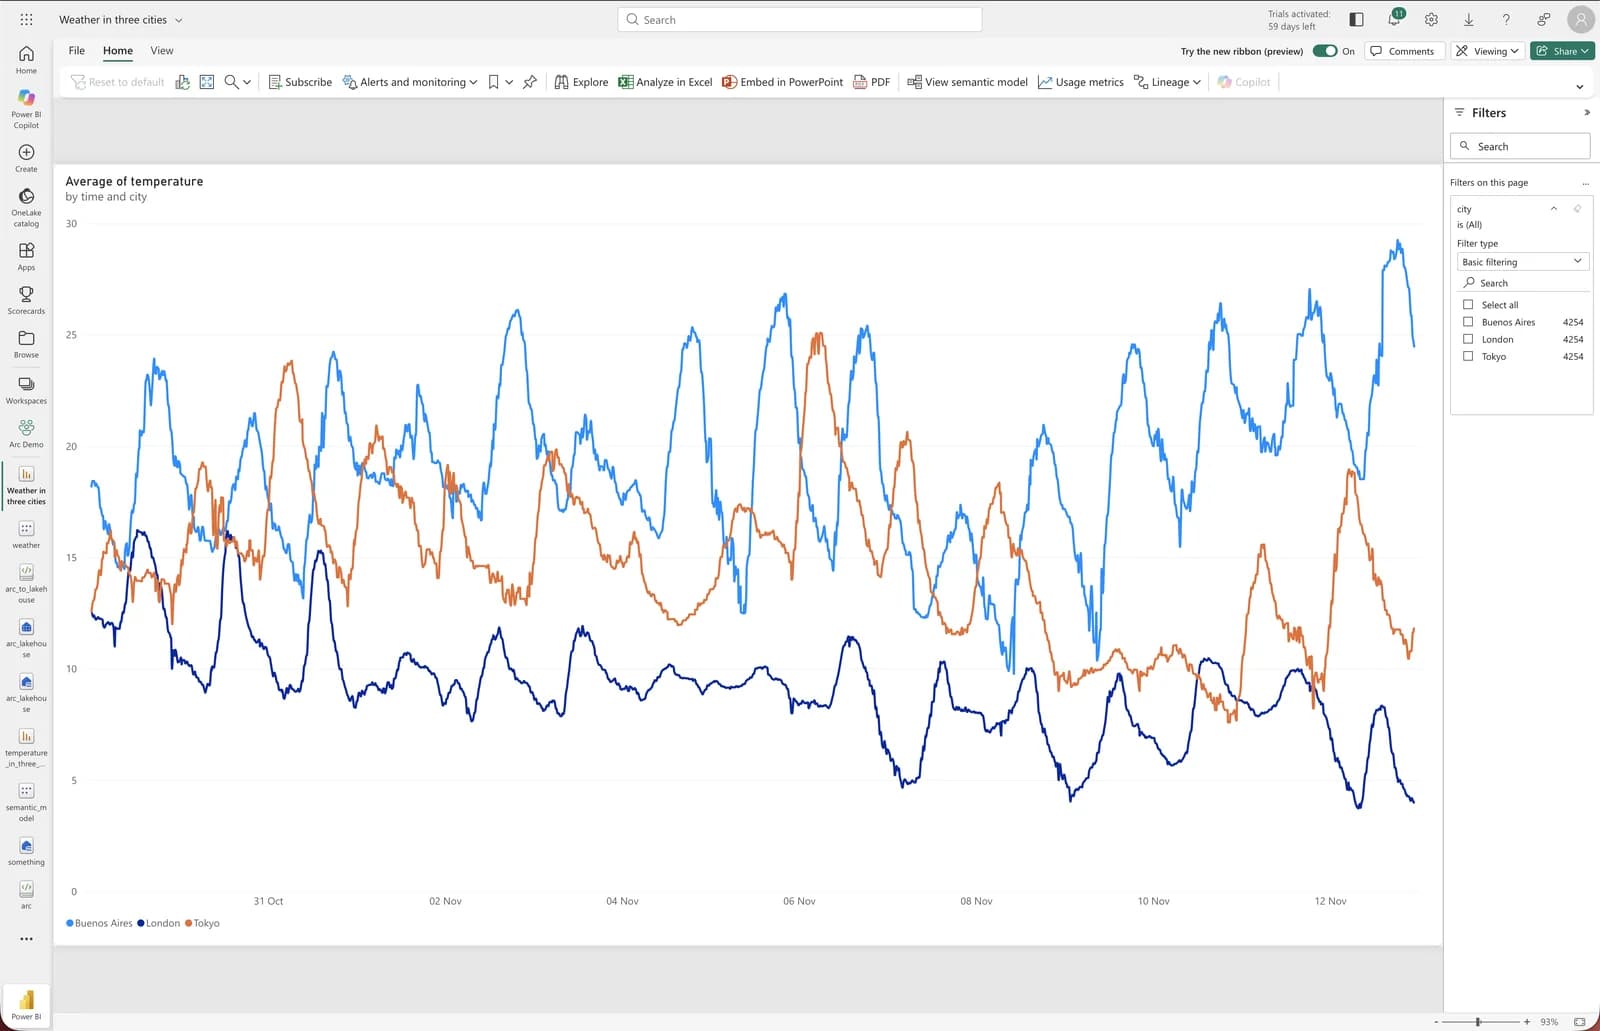
The filter pane shows 4,254 rows per city. Three cities make 12,762, exactly what the notebook received from Arc.
Keeping it fresh
The notebook's Settings → Schedule runs it on an interval. Hourly is a sensible start:
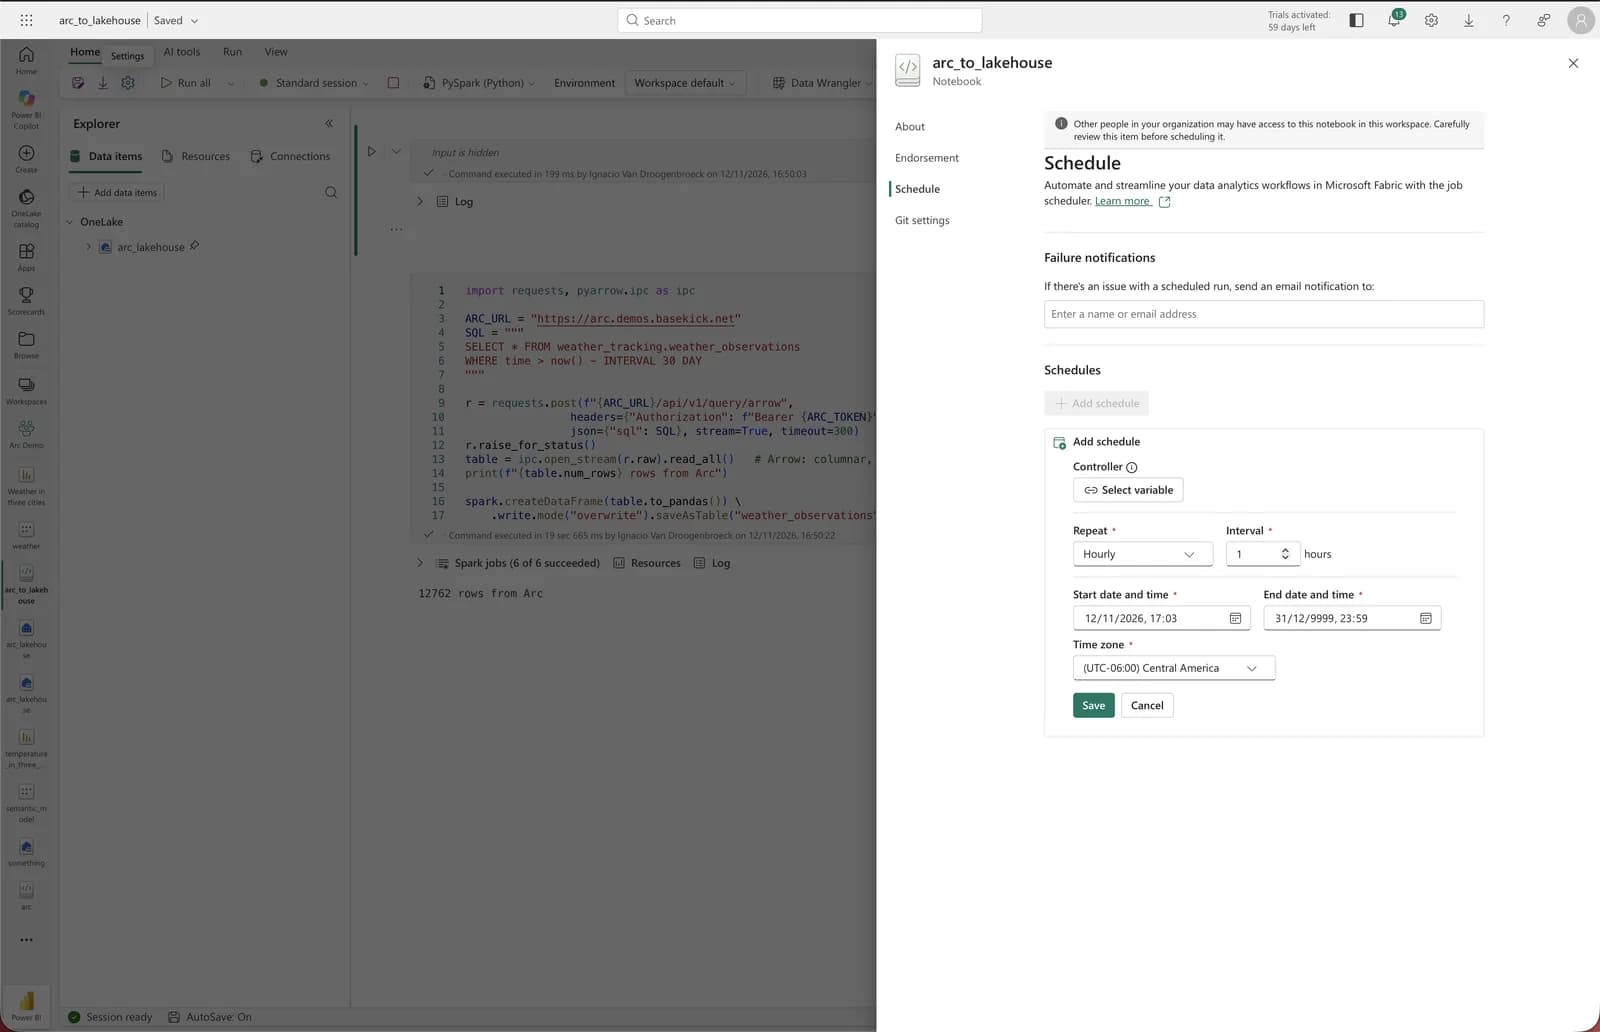
Each run replaces the table with the latest window from Arc. A report that is already open doesn't redraw by itself: click Refresh to see the new data.
What to watch for
- The token. Use a read-only token limited to the databases the report needs. On Arc Enterprise, RBAC applies to these queries like any other, and they appear in the audit log. For anything beyond a trial, keep the token in Azure Key Vault rather than in the notebook.
- Row caps. If the token has an Enterprise governance policy with a row cap, a query that hits it stops at the cap. Keep the cap above the window you pull.
- Size. The whole result passes through the notebook's memory. Bound it by time, or aggregate in SQL, rather than pulling a measurement's entire history every hour.
- Old versions. Before 25.12.1 there is no Arrow endpoint, but the JSON endpoint works with a few more lines. The guide has both.
What comes next
This is the path that works today. Two things in the next release make it shorter:
- Arrow Flight SQL. Arc 27.01.1 adds a native Flight SQL listener for ADBC clients. Power BI itself ships a Flight SQL ADBC driver, which opens the door to a direct connector.
- Iceberg on object storage. When Arc keeps its data in a bucket, its Iceberg export publishes tables a lakehouse engine can read in place, with no notebook copying data in between.
The step-by-step version, with every screenshot and the JSON variant for older releases, is in the docs: Microsoft Fabric and Power BI.