Monitor Indoor Air Quality with a Raspberry Pi and Arc — Temperature, Humidity, CO2, and TVOC in One Python Script

Every home monitoring project starts with the same good intention. You buy a sensor, wire it to a Raspberry Pi, print some values to the terminal, and think: this is great, I should save this somewhere. Then comes the part nobody talks about — figuring out how to actually store and query time-series data without spinning up a bunch of infrastructure and gluing everything together with configuration files.
This post shows you how to build a home air quality station with a Raspberry Pi 4, a DHT22 temperature/humidity sensor, and an SGP30 VOC/CO2 sensor — and send everything directly to Arc using the Python client. No brokers. No middleware. No extra containers. Just a Python script and a systemd service that starts on boot.
By the end you'll have four metrics flowing into Arc every 10 seconds: temperature, humidity, CO2 (eCO2), and total volatile organic compounds (TVOC). From there you can query with SQL, build dashboards in Grafana, or set up alerts — all the things you'd expect from a real time-series stack.
What You'll Need
Hardware:
- Raspberry Pi 4 (any RAM, any OS that runs Python 3.9+)
- DHT22 temperature and humidity sensor
- SGP30 air quality sensor (I2C)
- Jumper wires and a breadboard
- 7" touchscreen (optional — for a desk display)
Software:
- Arc Cloud — start free here, no credit card required
- Python 3.9+
- The
arc-client,adafruit-circuitpython-dht, andadafruit-circuitpython-sgp30libraries
Architecture
The setup is straightforward:
DHT22 (GPIO4)ab-─┐
                ├──► Raspberry Pi Python script ──► Arc ──► SQL / Grafana
SGP30 (I2C)----─┘
The Pi reads both sensors in a loop, compensates the SGP30 readings with real-time humidity data from the DHT22, and writes two measurements to Arc every 10 seconds: dht22 and sgp30. That's it.
Wiring
DHT22
| DHT22 Pin | Raspberry Pi Pin |
|---|---|
| VCC | 3.3V (Pin 1) |
| DATA | GPIO4 (Pin 7) |
| GND | GND (Pin 6) |
Add a 10kΩ pull-up resistor between VCC and DATA.
SGP30
The SGP30 communicates over I2C. On a Raspberry Pi, I2C is exposed on pins 3 (SDA) and 5 (SCL).
| SGP30 Pin | Raspberry Pi Pin |
|---|---|
| VIN | 3.3V (Pin 1) |
| GND | GND (Pin 6) |
| SDA | SDA (Pin 3) |
| SCL | SCL (Pin 5) |
Enable I2C on the Pi if you haven't already:
sudo raspi-config
# Interface Options → I2C → Enable
Verify the SGP30 is detected:
sudo i2cdetect -y 1
# You should see address 0x58
Setting Up the Environment
Install system dependencies for the DHT22 library:
sudo apt-get update
sudo apt-get install -y libgpiod2 python3-pip python3-venv
Create a virtual environment and install the Python packages:
cd /home/pi
python3 -m venv sensor_env
source sensor_env/bin/activate

pip install arc-client \
            adafruit-circuitpython-dht \
            adafruit-circuitpython-sgp30 \
            adafruit-blinka
The Script
Create /home/pi/dht22_arc.py:
import math
import time
import board
import busio
import adafruit_dht
import adafruit_sgp30
from arc_client import ArcClient

DHT_PIN = board.D4
ARC_HOST = "<your-arc-host>"
ARC_TOKEN = "<your-arc-token>"
ARC_DATABASE = "weather"
LOCATION = "living_room"

dht = adafruit_dht.DHT22(DHT_PIN)

i2c = busio.I2C(board.SCL, board.SDA, frequency=100000)
while True:
    try:
        sgp30 = adafruit_sgp30.Adafruit_SGP30(i2c)
        sgp30.iaq_init()
        break
    except (ValueError, OSError):
        print("SGP30 not ready, retrying in 5s...")
        time.sleep(5)

print("Warming up SGP30 (15s)...")
time.sleep(15)
print("Sending data to Arc... (Ctrl+C to stop)\n")

with ArcClient(host=ARC_HOST, port=443, token=ARC_TOKEN, database=ARC_DATABASE, ssl=True) as client:
    while True:
        now_us = int(time.time() * 1_000_000)

        # DHT22
        temperature = None
        humidity = None
        try:
            temperature = dht.temperature
            humidity = dht.humidity
            client.write.write_columnar(
                measurement="dht22",
                columns={
                    "time":        [now_us],
                    "temperature": [float(temperature)],
                    "humidity":    [float(humidity)],
                    "location":    [LOCATION],
                },
            )
            print(f"DHT22  → temp={temperature:.1f}°C  humidity={humidity:.1f}%")
        except RuntimeError as e:
            print(f"DHT22 error (retrying): {e}")

        # Apply humidity compensation to SGP30 (improves accuracy significantly)
        if temperature is not None and humidity is not None:
            try:
                abs_humidity = (humidity / 100.0) * 6.112 * math.exp(
                    (17.67 * temperature) / (temperature + 243.5)
                ) * 2.1674 / (273.15 + temperature)
                sgp30.set_iaq_humidity(abs_humidity)
            except Exception as e:
                print(f"SGP30 humidity compensation error (skipping): {e}")

        # SGP30
        try:
            co2 = sgp30.eCO2
            tvoc = sgp30.TVOC
            client.write.write_columnar(
                measurement="sgp30",
                columns={
                    "time":     [now_us],
                    "co2":      [float(co2)],
                    "tvoc":     [float(tvoc)],
                    "location": [LOCATION],
                },
            )
            print(f"SGP30  → co2={co2} ppm  tvoc={tvoc} ppb")
        except (OSError, TimeoutError) as e:
            print(f"SGP30 I2C error, reinitializing: {e}")
            time.sleep(2)
            try:
                sgp30 = adafruit_sgp30.Adafruit_SGP30(i2c)
                sgp30.iaq_init()
            except Exception as reinit_e:
                print(f"SGP30 reinit failed: {reinit_e}")

        time.sleep(10)
A few things worth noting:
SGP30 warm-up. The SGP30 needs about 15 seconds after power-on before its readings stabilize. The iaq_init() call and the sleep handle this. Skipping the warm-up gives you default values (400 ppm CO2, 0 ppb TVOC) that don't reflect actual conditions.
Humidity compensation. The SGP30 estimates CO2 and TVOC based on an internal baseline, and that baseline drifts with ambient humidity. Feeding it absolute humidity — calculated from the DHT22's relative humidity and temperature — keeps the readings accurate. Without this, CO2 readings can be off by 50–100 ppm in a typical home environment.
I2C reinitialization. I2C buses can lock up, especially on a Pi running other workloads. The script catches OSError and TimeoutError on the SGP30 and reinitializes the device in-place rather than crashing the whole loop.
write_columnar. Arc's Python client accepts columnar data — dictionaries of lists keyed by column name. Each call writes one row per measurement. The time column is in microseconds since epoch. The database and measurements are created automatically on first write — no setup needed upfront.
Running It as a Service
Test the script first:
source /home/pi/sensor_env/bin/activate
python /home/pi/dht22_arc.py
You should see output like:
Warming up SGP30 (15s)...
Sending data to Arc... (Ctrl+C to stop)

  measurement: dht22
  time        | temperature | humidity | location
  ------------|-------------|----------|-------------------------
  1743942800  | 24.3        | 62.4     | living_room

  measurement: sgp30
  time        | co2   | tvoc | location
  ------------|-------|------|-------------------------
  1743942800  | 512.0 | 18.0 | living_room
Once it's working, create a systemd service so it starts automatically on boot.
Create /etc/systemd/system/dht22-arc.service:
[Unit]
Description=DHT22 + SGP30 sensor station → Arc
After=network-online.target
Wants=network-online.target

[Service]
Type=simple
User=pi
WorkingDirectory=/home/pi
ExecStart=/home/pi/sensor_env/bin/python/home/pi/dht22_arc.py
Restart=always
RestartSec=10

[Install]
WantedBy=multi-user.target
Enable and start it:
sudo systemctl daemon-reload
sudo systemctl enable dht22-arc
sudo systemctl start dht22-arc
Check it's running:
sudo systemctl status dht22-arc
journalctl -u dht22-arc -f
From this point on, the Pi sends data to Arc every 10 seconds — through reboots, network drops, and anything else that comes up.
Querying Your Data
With data flowing, you can start asking questions immediately. Connect to your Arc instance and run SQL.
Latest readings:
SELECT time, temperature, humidity
FROM dht22
ORDER BY time DESC
LIMIT 10;
Hourly averages for the last 24 hours:
SELECT
    time_bucket(INTERVAL '1 hour', time) AS hour,
    round(avg(temperature), 1) AS avg_temp,
    round(avg(humidity), 1)    AS avg_humidity
FROM dht22
WHERE time >= now() - INTERVAL '24 hours'
GROUP BY 1
ORDER BY 1;
CO2 peaks — moments above 1000 ppm:
SELECT time, co2, tvoc
FROM sgp30
WHERE co2 > 1000
ORDER BY time DESC;
Join both sensors by time bucket:
SELECT
    d.bucket,
    d.temp,
    d.humidity,
    s.co2,
    s.tvoc
FROM (
    SELECT
        time_bucket(INTERVAL '1 minute', time) AS bucket,
        round(avg(temperature), 1) AS temp,
        round(avg(humidity), 1)    AS humidity
    FROM dht22
    WHERE time >= now() - INTERVAL '6 hours'
    GROUP BY 1
) d
JOIN (
    SELECT
        time_bucket(INTERVAL '1 minute', time) AS bucket,
        round(avg(co2))  AS co2,
        round(avg(tvoc)) AS tvoc
    FROM sgp30
    WHERE time >= now() - INTERVAL '6 hours'
    GROUP BY 1
) s ON d.bucket = s.bucket
ORDER BY d.bucket;
That last query is useful for building a unified dashboard — all four metrics aligned to the same time buckets.
What the Numbers Mean
A quick reference for interpreting the SGP30 output:
| eCO2 (ppm) | Air Quality |
|---|---|
| 400–600 | Excellent — outdoor-equivalent |
| 600–800 | Good |
| 800–1000 | Moderate — consider ventilation |
| 1000–1500 | Poor — open windows |
| >1500 | Very poor — needs immediate attention |
Fresh outdoor air sits around 420 ppm CO2. A closed bedroom after a night's sleep can easily hit 1200–1500 ppm. Cooking, cleaning products, and new furniture all spike TVOC.
Visualizing in Grafana
Arc ships with a native Grafana datasource. See the datasource setup post for full installation instructions. Once connected, use the SQL editor in any panel.
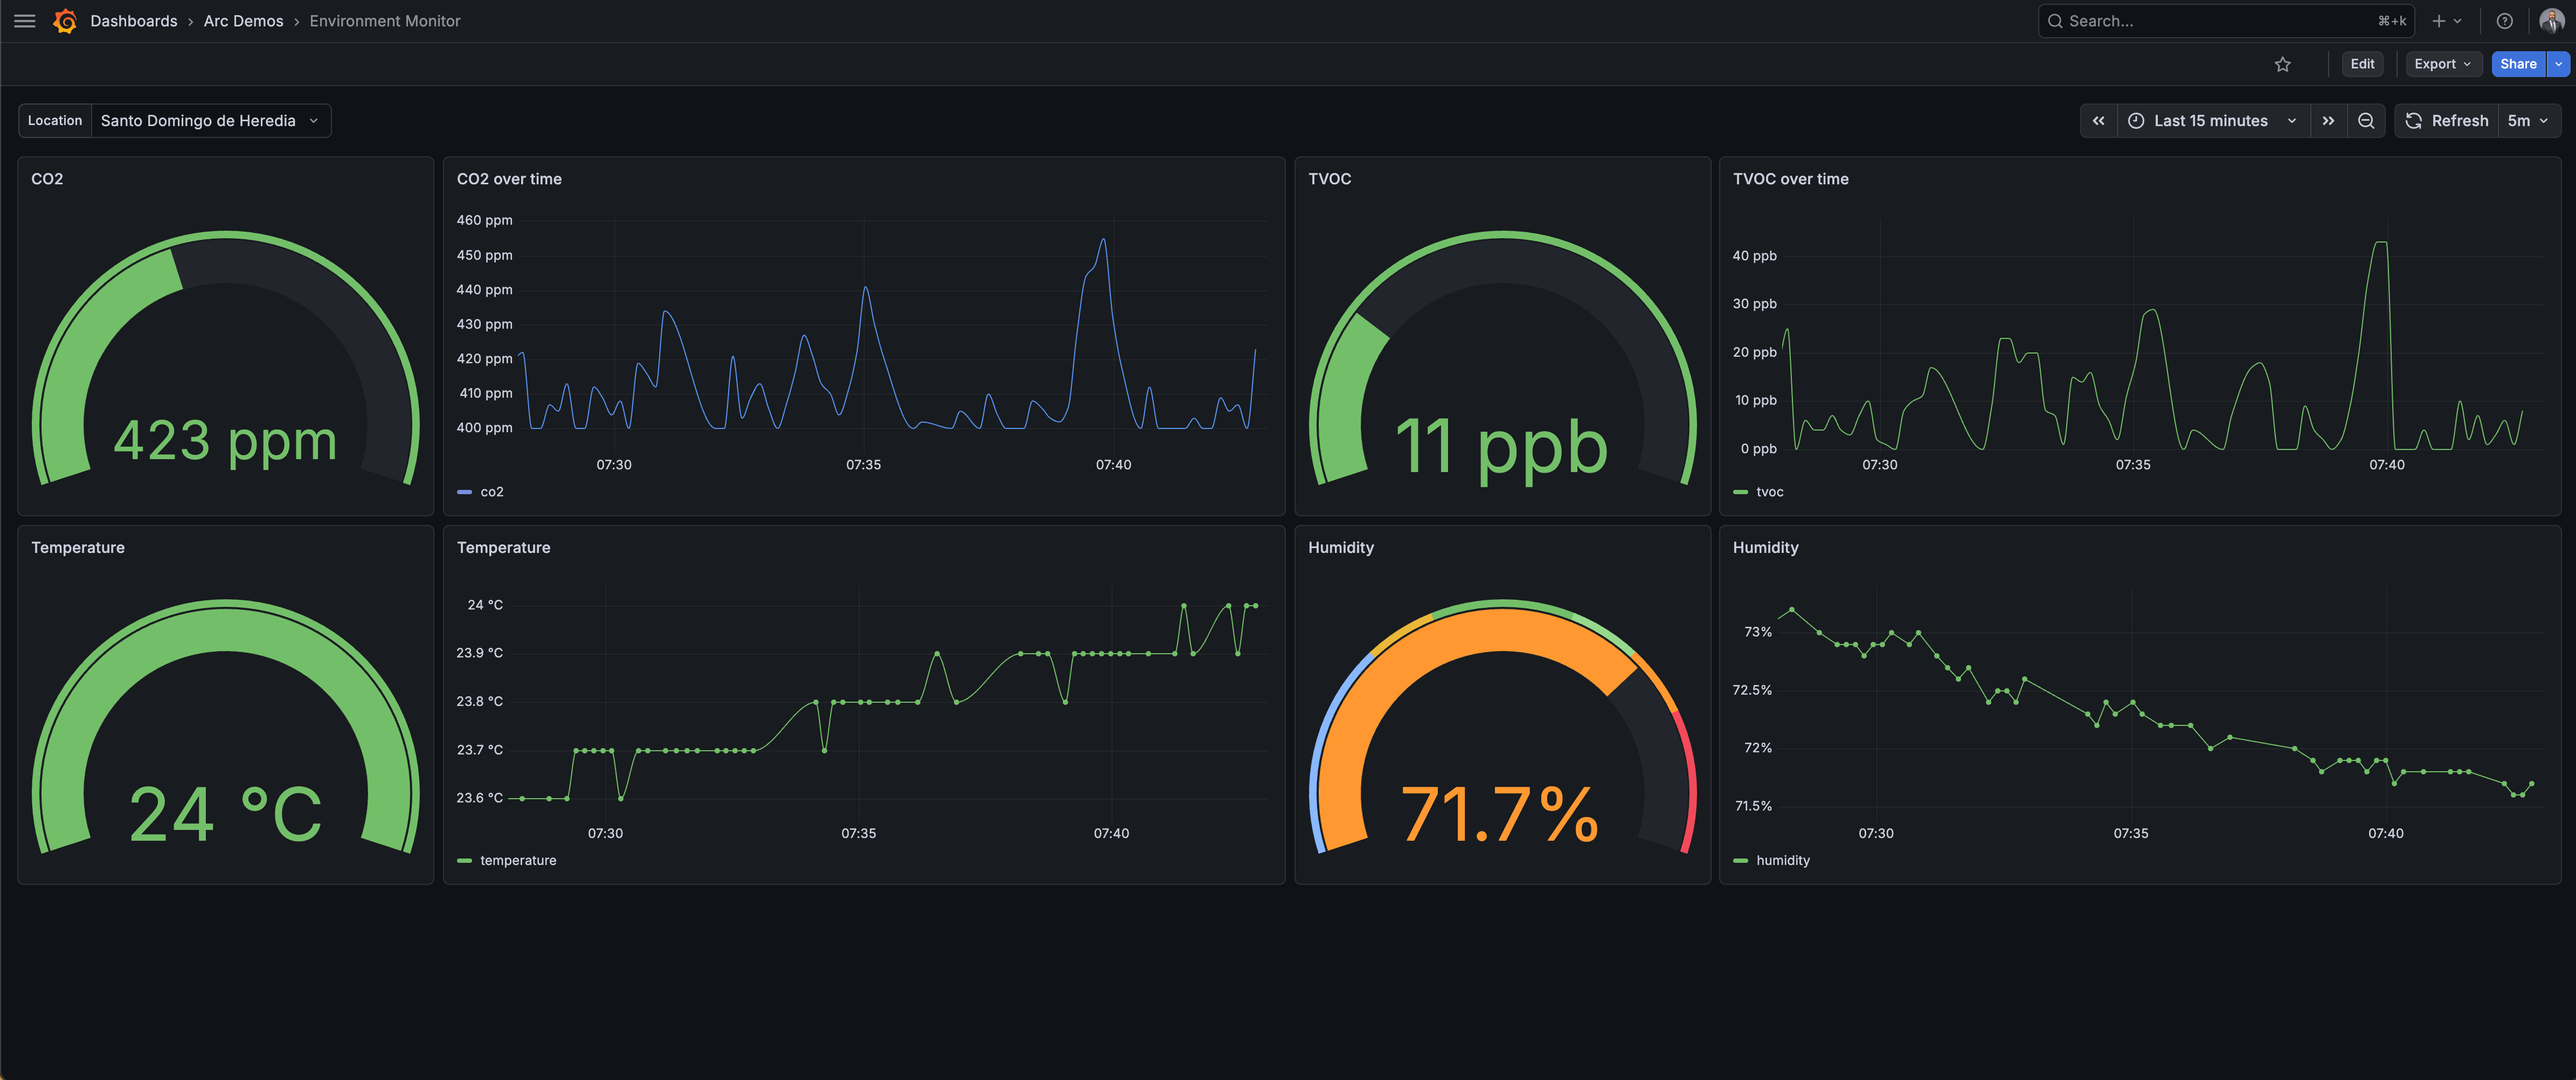
A practical dashboard for this setup:
- Time series panel — temperature and humidity from
dht22 - Time series panel — CO2 from
sgp30with a threshold line at 1000 ppm - Gauge panel — latest TVOC value
- Stat panel — current temperature and humidity
All panels use the same join query from above, scoped to different time ranges.
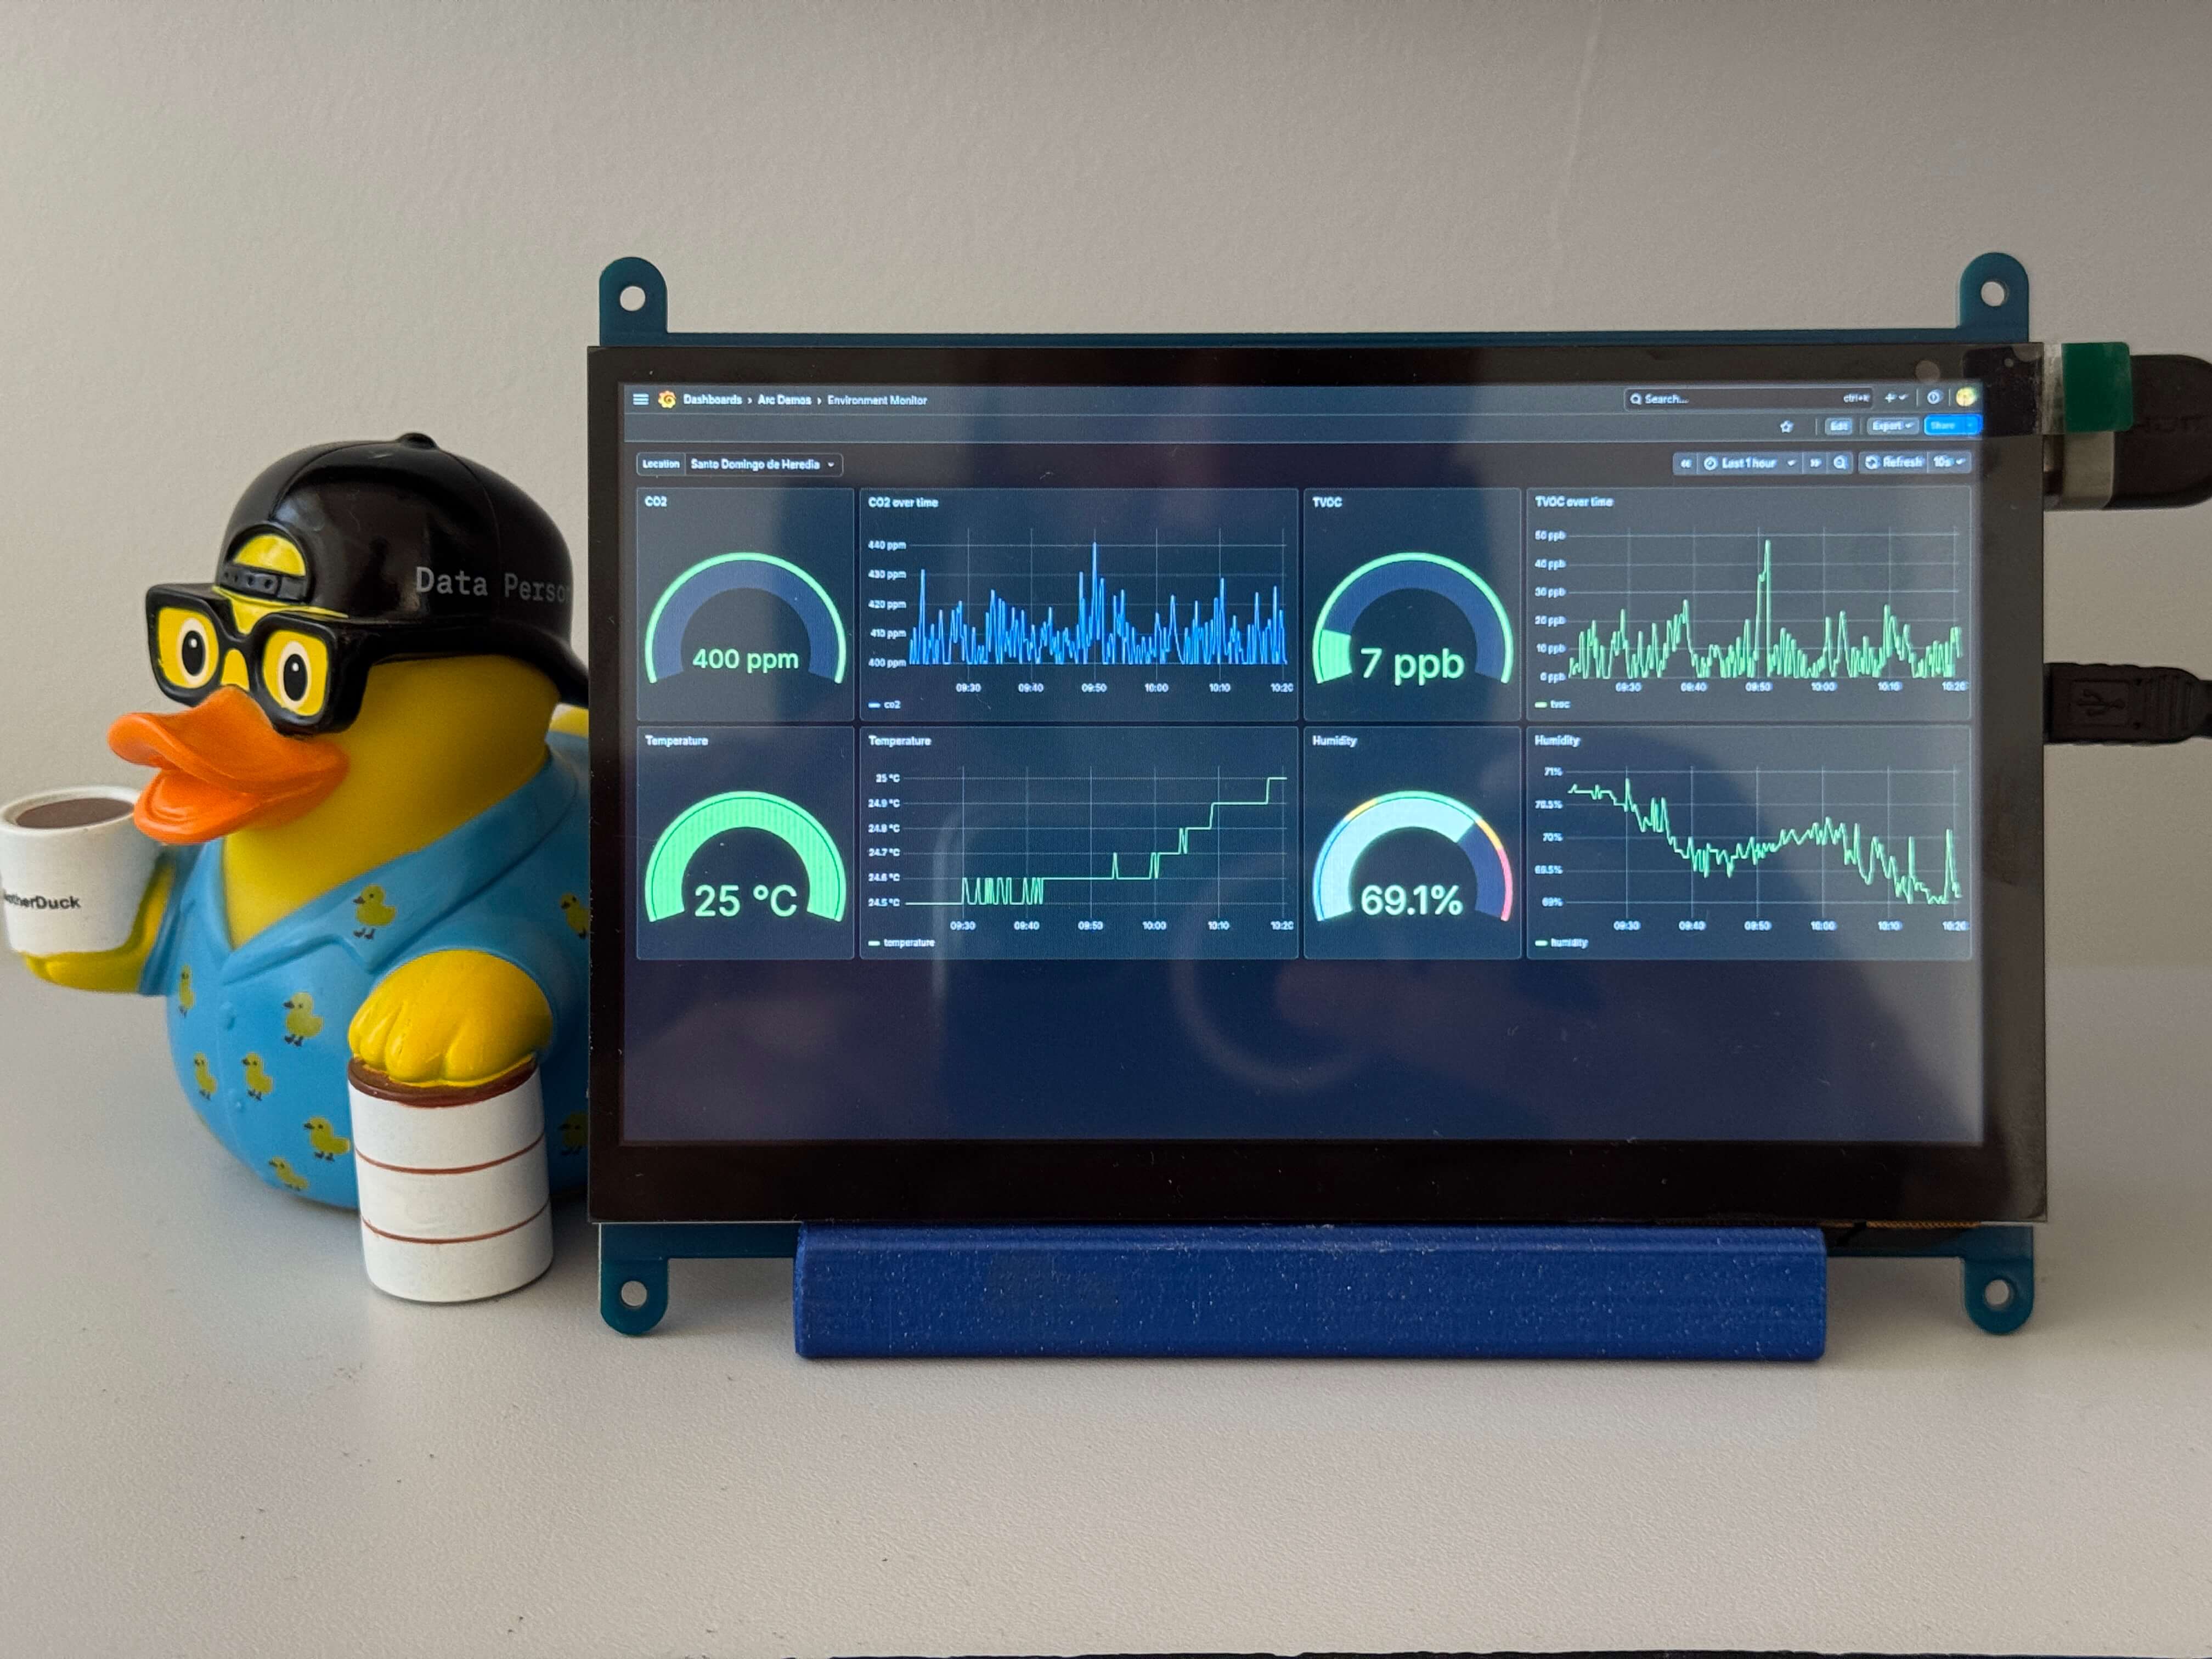
The Desk Display
One addition worth mentioning: I have a 7" touchscreen connected to the Pi showing the live metrics on my desk. Grafana runs in kiosk mode on the Pi's browser, pointed at the local instance. No separate hardware needed — the Pi handles both the sensing and the display.
Final Thoughts
The full thing — wiring, script, and service — takes under an hour to set up. What you get is a permanent, queryable air quality record for your home. Arc handles the storage and the SQL; the Pi handles the sensing; and a 50-line Python script connects them.
If you want to expand this, the same pattern works for any I2C or GPIO sensor on the Pi. Add a BMP280 for barometric pressure, a PMS5003 for particulate matter, or a second Pi in a different room — just write to the same Arc database and add a location tag to distinguish the sources.
The data is already there. Now you know how to actually use it.
Resources: