Monitor Arc with Arc: Prometheus Metrics & Self-Observability

You deploy Arc. It ingests data. It runs queries. It compacts Parquet files. It enforces retention policies. Everything looks fine.
Until it isn't.
One morning you wake up to a Slack message: "dashboards are slow." You SSH in. htop says CPU is at 40%, memory is at 60%. Nothing obvious. But something's off. You dig through logs. You guess. You restart the container. Problem goes away, or does it?
That's not observability. That's hope.
Arc ships with a Prometheus metrics endpoint that exposes over 70 metrics across ingestion, query, storage, compaction, auth, WAL, MQTT, and the DuckDB connection pool. It also has a built-in time-series collector that snapshots system, application, and API metrics every few seconds, an in-memory log buffer you can query via API, and /health and /ready endpoints designed for Kubernetes and load balancers.
In this post, I'll walk through everything Arc exposes, how to scrape it with Telegraf, how to store it in another Arc instance (yes, Arc monitoring Arc), and how to build Grafana dashboards that surface problems before your users notice.
What Arc exposes out of the box
No configuration. No plugins. No sidecars. Arc starts up, and these endpoints are live:
| Endpoint | Format | What it returns |
|---|---|---|
/metrics | Prometheus text | All counters and gauges, Prometheus-scrapeable |
/api/v1/metrics | JSON | Full snapshot of every metric |
/api/v1/metrics/memory | JSON | Detailed Go runtime memory stats |
/api/v1/metrics/query-pool | JSON | DuckDB connection pool + query stats |
/api/v1/metrics/endpoints | JSON | Per-endpoint HTTP, ingestion, buffer, storage, compaction, and auth stats |
/api/v1/metrics/timeseries/:type | JSON | Time-series buffer for system, application, or api |
/api/v1/logs | JSON | Recent application logs from the in-memory buffer |
/health | JSON | Liveness: is the process alive? |
/ready | JSON | Readiness: should the load balancer route traffic here? |
/metrics is public by default. No auth token needed: Prometheus scrapers don't speak Bearer tokens without extra wiring, and we didn't want to make you configure that. (If you need auth on /metrics, put a reverse proxy in front.)
The /api/v1/metrics/* endpoints are also public. They return JSON, which is less efficient for scraping but easier to consume from scripts, health-check automation, or CI.
Arc logs to stdout by default (JSON or console format, configurable via log.format). The /api/v1/logs endpoint returns recent entries from an in-memory circular buffer — useful for ad-hoc debugging. For long-term log storage, point Telegraf's tail input plugin at Docker's JSON log files or Kubernetes container logs and ship them to Arc alongside your metrics.
Here's what /metrics looks like:
# HELP arc_ingest_records_total Total records ingested
# TYPE arc_ingest_records_total counter
arc_ingest_records_total 2483910347

# HELP arc_query_requests_total Total query requests
# TYPE arc_query_requests_total counter
arc_query_requests_total 128443

# HELP arc_http_latency_seconds HTTP request latency
# TYPE arc_http_latency_seconds histogram
arc_http_latency_seconds_bucket{le="0.001"} 84721
arc_http_latency_seconds_bucket{le="0.005"} 129443
...
arc_http_latency_seconds_sum 187.432
arc_http_latency_seconds_count 130221
Standard Prometheus exposition format. Any scraper understands it.
The metric groups: what to watch
Let me walk through the metric families and which ones you actually want to alert on.
Ingestion: is data getting in?
arc_ingest_records_total
arc_ingest_bytes_total
arc_ingest_batches_total
arc_ingest_errors_total
arc_msgpack_requests_total
arc_msgpack_records_total
arc_lineprotocol_requests_total
arc_lineprotocol_records_total
Watch: arc_ingest_errors_total. If this counter is climbing, data is being rejected — malformed Line Protocol, schema mismatches, or a full WAL buffer. The ratio of line-protocol to MessagePack records tells you which ingestion path your workloads actually use.
Alert when:
rate(arc_ingest_errors_total[5m]) > 0
Every error is a data point that didn't land.
Query: are queries fast and succeeding?
arc_query_requests_total
arc_query_success_total
arc_query_errors_total
arc_query_timeouts_total
arc_slow_queries_total
arc_query_rows_total
arc_query_client_disconnects_total{path="arrow_ipc|arrow_json|sql_json"}
Watch: arc_slow_queries_total and the client-disconnect counters. A rising disconnect count on the arrow_json path usually means Grafana panels are timing out and the browser is closing the connection. On sql_json, it means scripts are getting killed mid-query.
Alert when:
rate(arc_query_timeouts_total[5m]) > 0.1
Queries are exceeding their deadline. Either your data grew, your queries got more complex, or you need to increase the timeout.
Buffer: the ingest pipeline's internal state
arc_buffer_records_buffered
arc_buffer_records_written_total
arc_buffer_flushes_total
arc_buffer_flush_failures_total
arc_buffer_queue_depth
Watch: arc_buffer_queue_depth — the number of Arrow record batches waiting to be flushed to Parquet. If it grows monotonically, storage writes can't keep up with ingest. arc_buffer_flush_failures_total is critical; each failure means records are preserved in the WAL for recovery instead of being written to storage.
Alert when:
arc_buffer_flush_failures_total > 0
Storage is failing. Check disk space, permissions, or S3 connectivity.
Storage: is data landing on disk?
arc_storage_writes_total
arc_storage_write_bytes_total
arc_storage_reads_total
arc_storage_read_bytes_total
arc_storage_errors_total
Watch: arc_storage_errors_total. Every increment is a failed read or write. For local storage, check disk health. For S3, check IAM permissions, bucket policies, and network connectivity.
Alert when:
rate(arc_storage_errors_total[5m]) > 0
Storage is broken. Queries and ingestion will degrade.
Compaction: is the background work healthy?
arc_compaction_jobs_total
arc_compaction_jobs_success_total
arc_compaction_jobs_failed_total
arc_compaction_manifests_recovered_total
Watch: arc_compaction_jobs_failed_total. Compaction merges small Parquet files into larger ones for query performance. If compaction is failing, queries will slow down as the file count grows. arc_compaction_manifests_recovered_total tells you how many times Arc recovered a partial compaction after a crash; non-zero is fine, but a spike means crashes are happening.
Alert when:
rate(arc_compaction_jobs_failed_total[1h]) > 0.05
Something is preventing compaction from completing.
Database connections: is DuckDB saturated?
arc_db_connections_open
arc_db_connections_in_use
arc_db_queries_total
arc_db_query_errors_total
Watch: the ratio of connections in use to connections open. If it sits near 1.0, queries are queuing. Increase the pool size or investigate slow queries holding connections.
Alert when:
arc_db_connections_in_use / arc_db_connections_open > 0.9
Sustained for more than 5 minutes.
Memory and runtime: is Go healthy?
arc_memory_alloc_bytes
arc_memory_heap_alloc_bytes
arc_memory_sys_bytes
arc_gc_cycles_total
arc_goroutines
arc_uptime_seconds
Watch: arc_memory_sys_bytes. If this grows monotonically without plateauing, you have a leak. The 26.06.1 release closed several known leaks — partition pruner caches, S3 HTTP transport buffers, orphaned DuckDB spill files — so if you're on an older version, update first, then investigate.
Alert when:
arc_memory_sys_bytes > 0.85 * container_memory_limit
Arc is approaching its memory ceiling.
WAL: the safety net
arc_wal_records_preserved_total
arc_wal_recovery_total
arc_wal_recovery_records_total
arc_wal_dropped_entries_total
Watch: arc_wal_dropped_entries_total. Every increment is a record lost because the WAL buffer was full. Increase wal.buffer_size if this grows. arc_wal_recovery_total tells you how many times Arc recovered from the WAL after a crash; non-zero is expected after restarts, but frequent recoveries mean frequent crashes.
Alert when:
rate(arc_wal_dropped_entries_total[5m]) > 0
You're losing data.
Auth: who's knocking?
arc_auth_requests_total
arc_auth_cache_hits_total
arc_auth_cache_misses_total
arc_auth_failures_total
Watch: arc_auth_failures_total. A climbing rate means someone is probing with bad tokens, or a legitimate client has an expired token and is retrying.
Alert when:
rate(arc_auth_failures_total[5m]) > 10
Investigate.
Enterprise-only metrics
If you're running Arc Enterprise with clustering, you also get:
arc_cluster_manifest_rejected_paths_total       # Security: malicious path proposals blocked
arc_cluster_auth_apply_create_total             # Token creates replicated via Raft
arc_cluster_auth_rejected_total                 # Malformed token proposals refused
arc_replication_entries_dropped_total           # Replication buffer overflow
arc_replication_sequence_gaps_total             # Missing entries on receivers
And the full RBAC command distribution — create, update, and delete counters for organizations, teams, roles, measurement permissions, and token-to-team mappings.
Alert when:
rate(arc_cluster_manifest_rejected_paths_total[5m]) > 0
A peer, snapshot, or Raft log entry proposed a path the FSM refused. This is the security canary for CVE-2026-48106-class attacks.
The time-series collector: Arc's internal historian
Beyond the Prometheus counters, Arc maintains an in-process time-series buffer that snapshots system, application, and API metrics at a configurable interval. Think of it as Arc's own internal sar: lightweight, always on, queryable via API.
GET /api/v1/metrics/timeseries/system?duration_minutes=15
GET /api/v1/metrics/timeseries/application?duration_minutes=30
GET /api/v1/metrics/timeseries/api?duration_minutes=60
Each returns a JSON array of timestamped points. The system type includes goroutine count, memory breakdown (alloc, heap, stack, GC), and CPU stats. The application type tracks ingest totals, query counts, buffer state, storage I/O, and compaction activity. The api type covers HTTP request counts, latency averages, DB connection pool state, and auth cache performance.
Configuration in arc.toml:
[metrics]
timeseries_retention_minutes = 30   # How long to keep points (default: 30, max: 1440)
timeseries_interval_seconds = 5     # How often to collect (default: 5)
Or via environment variables:
export ARC_METRICS_TIMESERIES_RETENTION_MINUTES=60
export ARC_METRICS_TIMESERIES_INTERVAL_SECONDS=10
This collector is designed for ad-hoc inspection, not long-term storage. For long-term trend analysis, scrape /metrics into a time-series database, like Arc.
Monitor Arc with Arc
Here's where it gets meta.
Every Arc instance (production, staging, dev) exposes /metrics. You can scrape those endpoints with Telegraf and write the metrics into another Arc instance. That second Arc instance becomes your observability database.
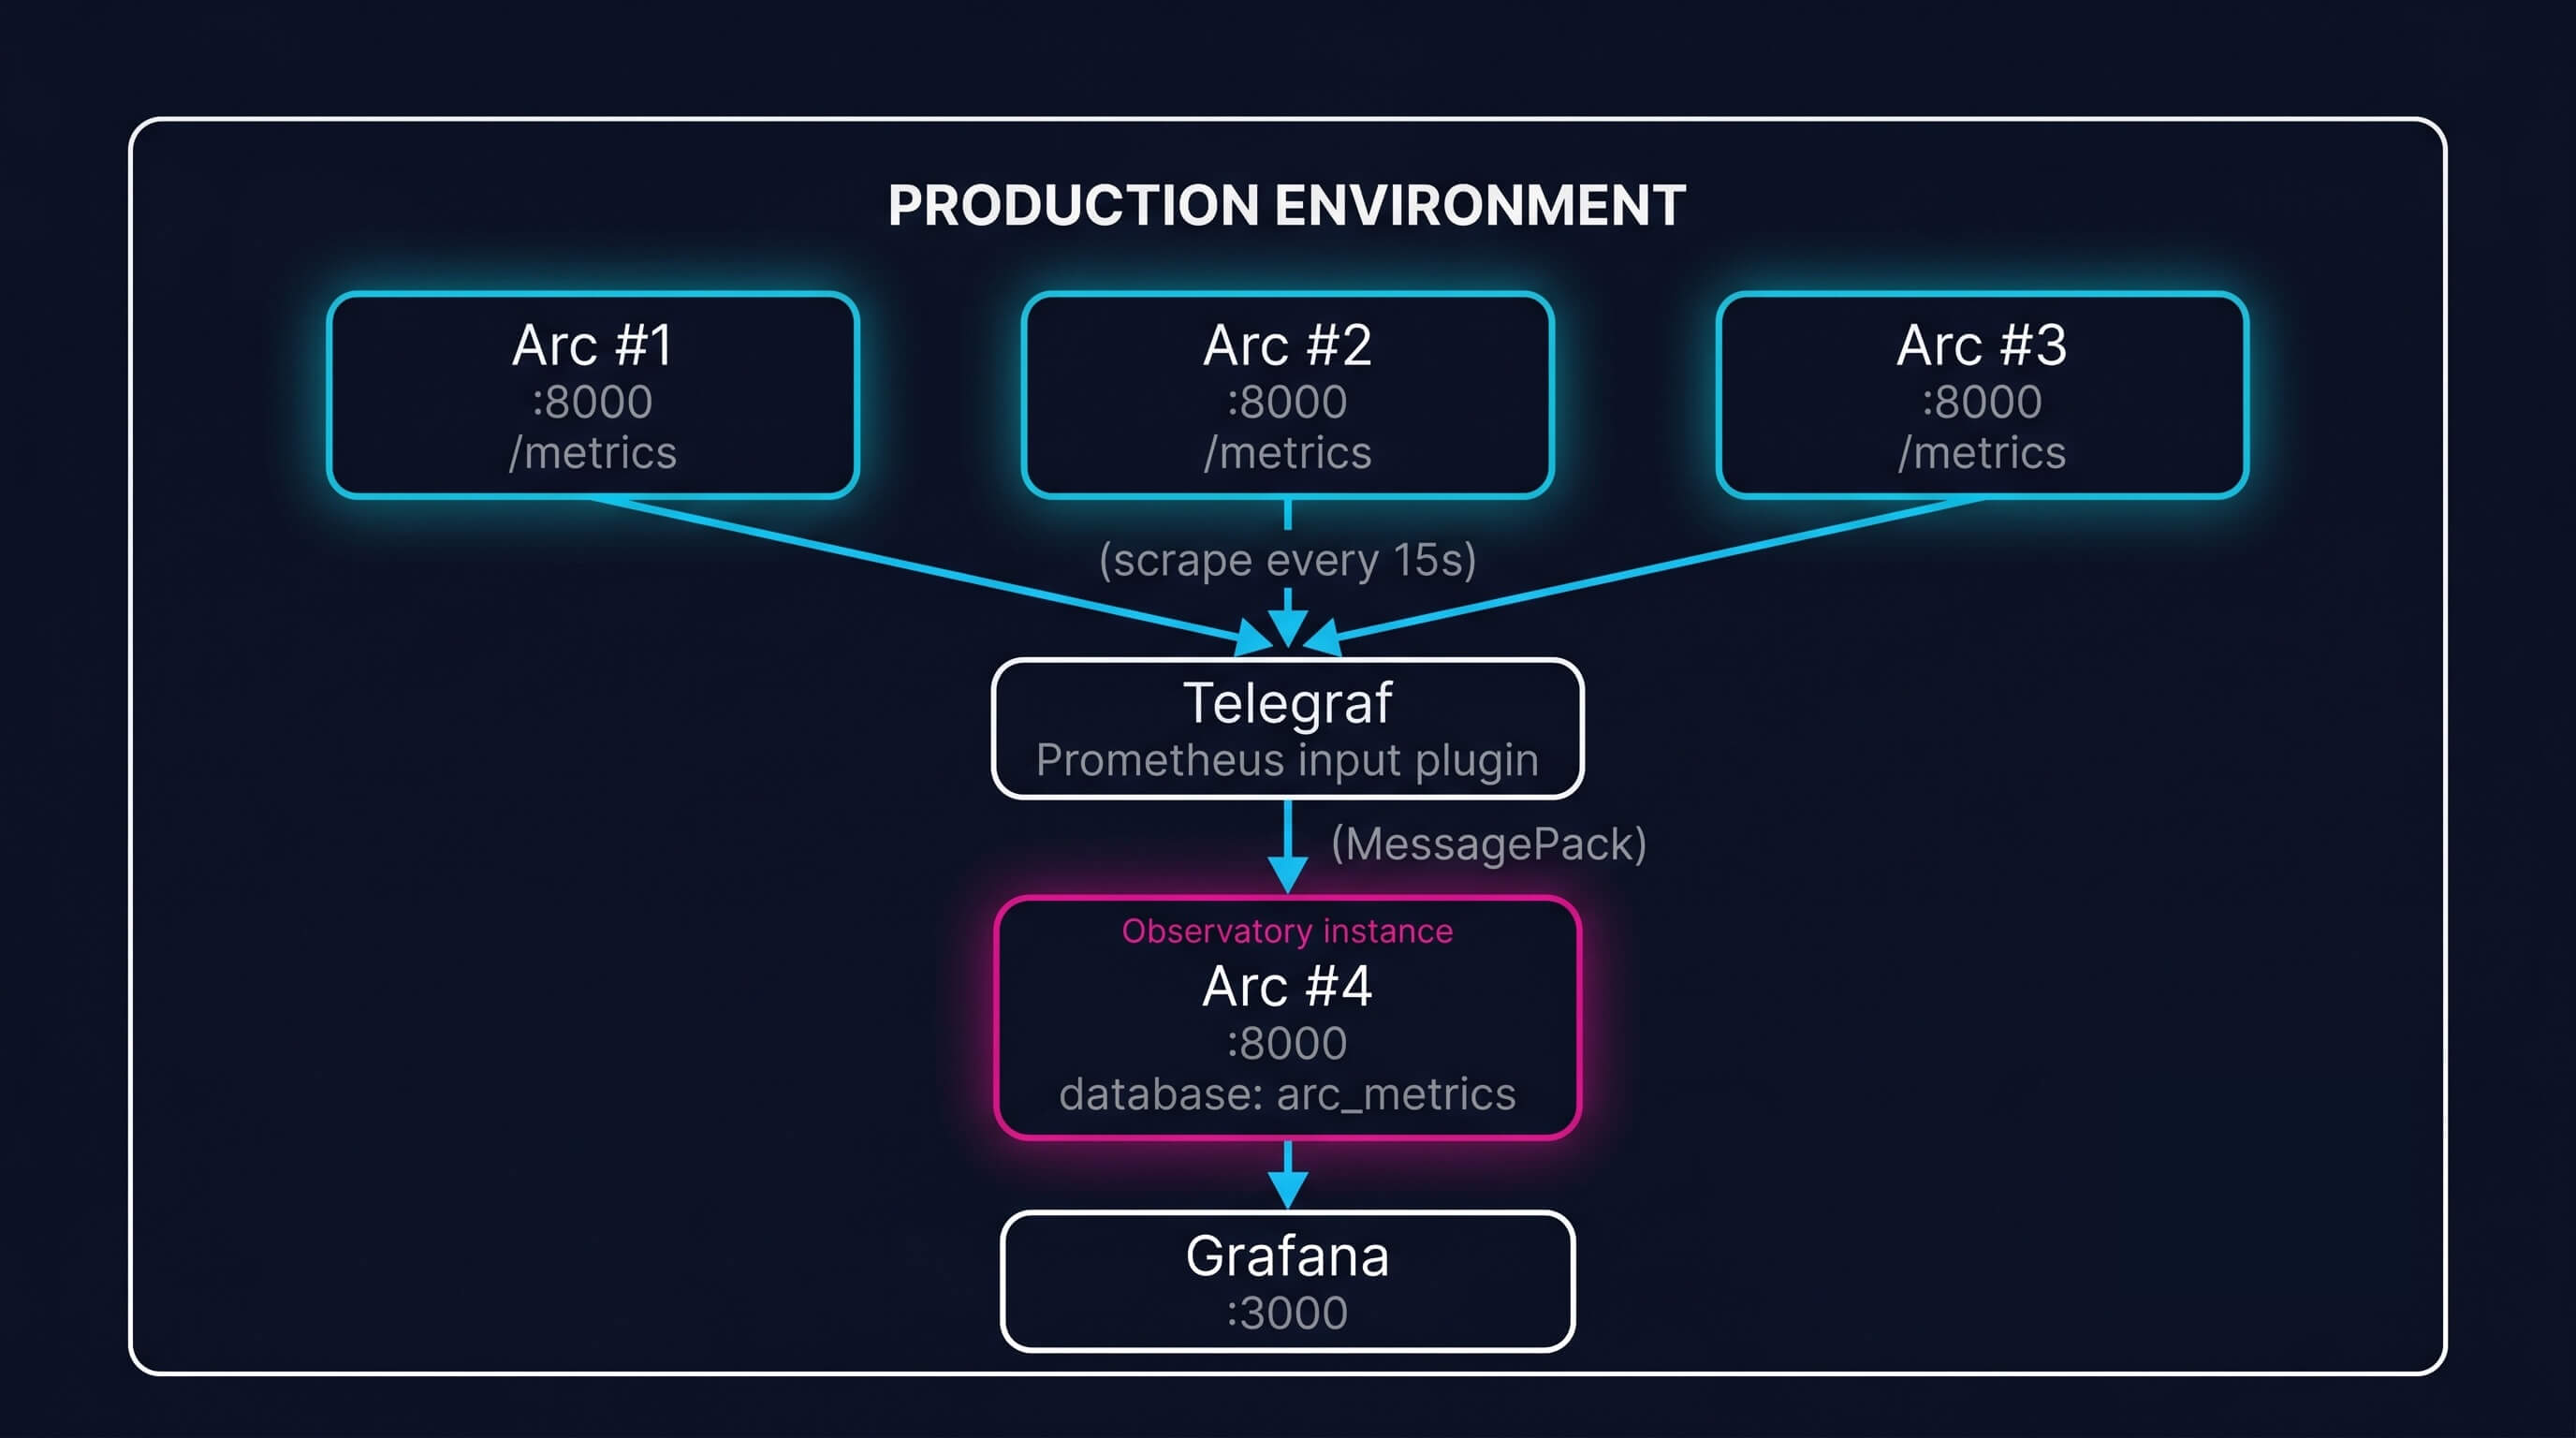
Step 1: Set up the observatory Arc instance
Deploy a dedicated Arc instance for metrics storage. It doesn't need to be big: a single node with a few hundred GB of storage is plenty for months of metrics history.
docker run -d \
  --name arc-observatory \
  -p 8001:8000 \
  -e STORAGE_BACKEND=local \
  -e DB_PATH=/data/arc-observatory.db \
  -v arc-observatory-data:/data \
  ghcr.io/basekick-labs/arc:latest
Create a database for metrics:
curl -X POST http://localhost:8001/api/v1/query \
  -H "Authorization: Bearer $ARC_TOKEN" \
  -H "Content-Type: application/json" \
  -d '{"sql": "CREATE DATABASE arc_metrics"}'
Step 2: Scrape with Telegraf
Telegraf's inputs.prometheus plugin scrapes any Prometheus endpoint. The Arc output plugin writes metrics using MessagePack, Arc's native columnar protocol, for maximum throughput. Line Protocol is also supported for teams migrating from InfluxDB. Point Telegraf at your production Arc instances:
# telegraf.conf
[[inputs.prometheus]]
  urls = [
    "http://arc-prod-1:8000/metrics",
    "http://arc-prod-2:8000/metrics",
    "http://arc-prod-3:8000/metrics"
  ]
  interval = "15s"
  metric_version = 2

  # Tag each instance so you can filter in Grafana
  [inputs.prometheus.tags]
    environment = "production"

[[outputs.arc]]
  url = "http://arc-observatory:8000"
  database = "arc_metrics"
  token = "$ARC_OBSERVATORY_TOKEN"
Every 15 seconds, Telegraf scrapes all three production instances, tags each metric with the source host and environment, and writes them to the observatory Arc instance.
Step 3: Query your metrics with SQL
Now you have all of Arc's Prometheus metrics stored as time-series data in Arc. Query them with standard SQL:
-- Which instance has the highest ingestion error rate?
SELECT
  host,
  SUM(value) as total_errors
FROM arc_metrics.arc_ingest_errors_total
WHERE time > NOW() - INTERVAL '1 hour'
GROUP BY host
ORDER BY total_errors DESC;

-- Are any instances leaking memory?
SELECT
  host,
  MAX(value) / 1024 / 1024 / 1024 as peak_memory_gb
FROM arc_metrics.arc_memory_sys_bytes
WHERE time > NOW() - INTERVAL '24 hours'
GROUP BY host
ORDER BY peak_memory_gb DESC;

-- Query latency distribution across the cluster
SELECT
  host,
  AVG(value) as avg_latency_seconds,
  PERCENTILE_CONT(0.99) WITHIN GROUP (ORDER BY value) as p99_latency
FROM arc_metrics.arc_http_latency_seconds_sum
WHERE time > NOW() - INTERVAL '1 hour'
GROUP BY host;
This is the power of self-observability: you're using the same SQL, the same query engine, the same Parquet storage you already know.
Step 4: Build Grafana dashboards
The Grafana Arc Datasource connects directly to your observatory Arc instance. Build dashboards with panels for:
Ingestion health: records/sec, bytes/sec, error rate per instance Query performance: requests/sec, p50/p99 latency, timeout rate, slow query count Buffer state: queue depth, flush rate, flush failures Storage I/O: writes/sec, bytes written/sec, error rate Compaction: jobs completed vs failed, bytes compacted Memory: RSS, heap, GC cycles, goroutine count Auth: requests/sec, cache hit ratio, failure rate Logs: error rate by component, warn/error log counts
For Enterprise deployments, add panels for replication health (entries dropped, sequence gaps) and cluster auth (token creates/revokes per node).
/health and /ready: Kubernetes and load balancer integration
Arc exposes two endpoints designed for orchestration:
/health: Returns 200 as long as the process is alive. Use this for Kubernetes liveness probes. If /health stops responding, the container is dead and the kubelet should restart it.
/ready: Returns 200 only when Arc is ready to accept traffic. Returns 503 during startup (WAL recovery in progress, DuckDB initializing) and during graceful shutdown (draining in-flight requests). Use this for Kubernetes readiness probes and load balancer health checks.
# Kubernetes pod spec excerpt
livenessProbe:
  httpGet:
    path: /health
    port: 8000
  initialDelaySeconds: 10
  periodSeconds: 10

readinessProbe:
  httpGet:
    path: /ready
    port: 8000
  initialDelaySeconds: 5
  periodSeconds: 5
The distinction matters. A live Arc that isn't ready (WAL replay in progress) should not receive traffic, but it shouldn't be killed either. /health and /ready give you that control.
Alerting: what to wake up for
Not every metric deserves a pager. Here's the short list of alerts that have caught real problems in production Arc deployments:
| Alert | Condition | Why |
|---|---|---|
| Ingestion errors | rate(arc_ingest_errors_total[5m]) > 0 | Data loss. Every error is a record that didn't land. |
| Buffer flush failures | arc_buffer_flush_failures_total > 0 | Storage is failing. Records are stacking up in WAL. |
| Storage errors | rate(arc_storage_errors_total[5m]) > 0 | Disk or S3 is broken. Everything degrades. |
| Query timeout rate | rate(arc_query_timeouts_total[5m]) > 0.1 | Users are waiting. Investigate slow queries. |
| Connection pool saturation | arc_db_connections_in_use / arc_db_connections_open > 0.9 | Queries are queuing. Increase pool or find slow queries. |
| Memory approaching limit | arc_memory_sys_bytes > 0.85 * limit | OOM-kill imminent. Investigate or increase limit. |
| Compaction failure rate | rate(arc_compaction_jobs_failed_total[1h]) > 0.05 | Query performance will degrade as file count grows. |
| WAL drops | rate(arc_wal_dropped_entries_total[5m]) > 0 | WAL buffer full. Increase size or investigate ingest burst. |
| RSS monotonic growth | deriv(arc_memory_sys_bytes[6h]) > 0 for 24h | Memory leak. Update Arc, then investigate. |
For Enterprise: add arc_cluster_manifest_rejected_paths_total > 0 (security canary) and rate(arc_replication_entries_dropped_total[5m]) > 0 (replication buffer overflow).
One query to rule them all
Here's a query that gives you a one-shot health summary of every Arc instance you're monitoring:
WITH latest AS (
  SELECT
    host,
    MAX(time) as last_seen
  FROM arc_metrics.arc_uptime_seconds
  GROUP BY host
)
SELECT
  l.host,
  l.last_seen,
  COALESCE(ingest_err.value, 0) as ingest_errors_5m,
  COALESCE(flush_fail.value, 0) as flush_failures,
  COALESCE(storage_err.value, 0) as storage_errors,
  COALESCE(query_timeout.value, 0) as query_timeouts_5m,
  ROUND(COALESCE(mem.value, 0) / 1024 / 1024 / 1024, 2) as memory_gb,
  CASE
    WHEN COALESCE(ingest_err.value, 0) > 0 THEN '⚠ ingest errors'
    WHEN COALESCE(flush_fail.value, 0) > 0 THEN '⚠ flush failures'
    WHEN COALESCE(storage_err.value, 0) > 0 THEN '⚠ storage errors'
    ELSE '✓ healthy'
  END as status
FROM latest l
LEFT JOIN (
  SELECT host, SUM(value) as value
  FROM arc_metrics.arc_ingest_errors_total
  WHERE time > NOW() - INTERVAL '5 minutes'
  GROUP BY host
) ingest_err ON l.host = ingest_err.host
LEFT JOIN (
  SELECT host, MAX(value) as value
  FROM arc_metrics.arc_buffer_flush_failures_total
  GROUP BY host
) flush_fail ON l.host = flush_fail.host
LEFT JOIN (
  SELECT host, SUM(value) as value
  FROM arc_metrics.arc_storage_errors_total
  WHERE time > NOW() - INTERVAL '5 minutes'
  GROUP BY host
) storage_err ON l.host = storage_err.host
LEFT JOIN (
  SELECT host, SUM(value) as value
  FROM arc_metrics.arc_query_timeouts_total
  WHERE time > NOW() - INTERVAL '5 minutes'
  GROUP BY host
) query_timeout ON l.host = query_timeout.host
LEFT JOIN (
  SELECT host, MAX(value) as value
  FROM arc_metrics.arc_memory_sys_bytes
  WHERE time > NOW() - INTERVAL '1 minute'
  GROUP BY host
) mem ON l.host = mem.host
ORDER BY l.host;
Run that every morning. Or better, put it in a Grafana dashboard and glance at it between coffee sips.
What we're monitoring internally
At Basekick Labs, we run Arc to monitor Arc. Our observatory instance ingests metrics and logs from every environment — production, staging, CI, and the demo cluster at basekick.net/demos. Metrics flow through Telegraf's Prometheus input plugin, logs through the tail plugin pointed at Docker's JSON log files, both landing in an Arc instance backed by S3 with 90-day retention. We visualize everything in Grafana through the Arc data source plugin.
The dashboard that catches the most issues? A single row with four stat panels: ingest errors (last 5m), buffer flush failures, storage errors, and query timeouts. If all four are zero, the morning is good. If any are non-zero, we know exactly which instance and which metric to drill into.
No guesswork. No SSH. No "let me restart it and see."
Wrapping up
Arc's observability surface is broad and zero-config. The /metrics endpoint gives you 70+ Prometheus metrics. The time-series collector gives you point-in-time snapshots. /health and /ready give Kubernetes and load balancers what they need. And with Telegraf + another Arc instance, you can build a self-contained observability stack where you query your database's metrics with the same SQL and same tools you already use.
If you're running Arc in production and haven't set up monitoring yet, start with the three alerts that matter most: ingest errors, buffer flush failures, and storage errors. Everything else is refinement.
Get started:
- Arc documentation
- Grafana Arc Datasource
- Telegraf output plugin for Arc
- Star Arc on GitHub
- Join the Discord
Questions? Discord or GitHub Issues.