I Replaced Our Entire OpenShift Observability Stack With One Database

If you run OpenShift, you've lived through the logging stack churn. First it was EFK—Elasticsearch, Fluentd, Kibana. Three components, tightly coupled, resource-hungry, but at least it worked. Then Red Hat deprecated EFK and told everyone to migrate to LokiStack. So you did. Or you tried to. And you discovered that LokiStack means running a Distributor, an Ingester, a Querier, a Compactor, and MinIO or S3 behind it all—just to search your container logs.
And that's only half the picture. Your metrics still live in Prometheus. Which means you're also running the Prometheus Operator, Alertmanager, and maybe Thanos for anything beyond two weeks of retention. That's eight-plus components for observability. Eight things to monitor, patch, and troubleshoot when your cluster is already the thing that needs monitoring.
Oh, and if you upgraded from OCP 4.12 to 4.13, the Cluster Logging Operator switched from Fluentd to Vector under the hood. If you had custom Fluentd configs, they broke. If you had custom pipelines, some of them silently stopped working. I've heard this story from enough OpenShift admins to know it's not an edge case—it's the common path.
What if your logs and metrics went to the same place? One database. One query language. One storage format. That's what we're building today: OpenShift's ClusterLogForwarder ships logs via syslog to Telegraf, a Telegraf DaemonSet collects node and pod metrics, and everything lands in Arc. Grafana on top for dashboards. Three components. Done.
The Architecture
Here's what we're building:
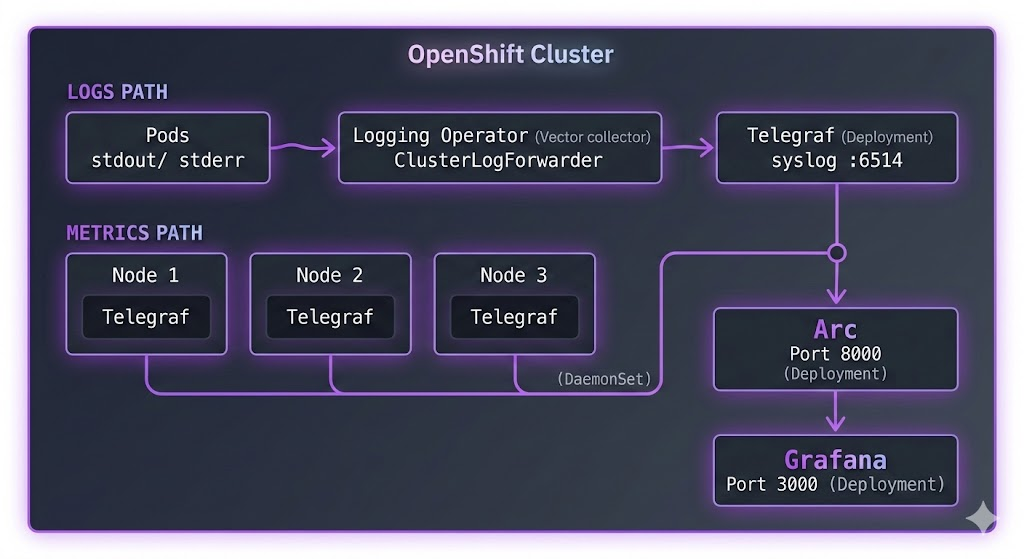
Two data paths, one destination.
Logs flow through OpenShift's native Cluster Logging Operator. The ClusterLogForwarder CR sends them via syslog to a Telegraf Deployment, which writes to Arc.
Metrics come from a Telegraf DaemonSet—one instance per node—collecting Kubelet metrics, CPU, memory, disk, and network stats. Same Arc instance, same database.
Why two Telegraf instances? The metrics DaemonSet needs to run on every node to access host-level metrics via /proc and /sys. The log receiver only needs one pod—the Logging Operator pushes to it over the network. Different scaling needs, so we keep them separate.
For reference: LokiStack needs Distributor, Ingester, Querier, Compactor, and MinIO. Prometheus needs the Operator, Alertmanager, and Thanos for long-term retention. That's eight or more components. This stack is three.
Prerequisites
Before we start:
- A running OpenShift cluster (OCP 4.10+)
- The OpenShift Logging Operator installed from OperatorHub
ocCLI configured with cluster-admin access- Basic familiarity with YAML manifests
If you're on OCP 4.12 or earlier, your Logging Operator uses Fluentd. OCP 4.13+ uses Vector. The ClusterLogForwarder CR syntax is the same either way—that's the beauty of the abstraction.
Step 1: Deploy Arc
First, let's get Arc running. We'll create a dedicated monitoring namespace.
Create arc-deployment.yaml:
apiVersion: v1
kind: Namespace
metadata:
  name: monitoring
---
apiVersion: v1
kind: PersistentVolumeClaim
metadata:
  name: arc-data
  namespace: monitoring
spec:
  accessModes:
    - ReadWriteOnce
  resources:
    requests:
      storage: 20Gi
---
apiVersion: apps/v1
kind: Deployment
metadata:
  name: arc
  namespace: monitoring
spec:
  replicas: 1
  selector:
    matchLabels:
      app: arc
  template:
    metadata:
      labels:
        app: arc
    spec:
      containers:
        - name: arc
          image: ghcr.io/basekick-labs/arc:latest
          ports:
            - containerPort: 8000
          env:
            - name: STORAGE_BACKEND
              value: "local"
          volumeMounts:
            - name: data
              mountPath: /app/data
          resources:
            requests:
              memory: "512Mi"
              cpu: "500m"
            limits:
              memory: "4Gi"
              cpu: "2000m"
      volumes:
        - name: data
          persistentVolumeClaim:
            claimName: arc-data
---
apiVersion: v1
kind: Service
metadata:
  name: arc
  namespace: monitoring
spec:
  selector:
    app: arc
  ports:
    - port: 8000
      targetPort: 8000
A few things to note:
- 20Gi PVC gives plenty of room. Arc's Parquet compression means you're storing 3-5x less than raw logs.
- 4Gi memory limit gives Arc headroom for query caching on larger datasets.
- The Service creates
arc.monitoring.svc.cluster.local—both Telegraf instances will use this.
OpenShift SCC note: If the pod stays in Pending or CrashLoopBackOff, you likely need to grant the service account permission to run. OpenShift's default security context constraints are stricter than vanilla Kubernetes:
oc adm policy add-scc-to-serviceaccount -n monitoring -z default anyuidApply and wait for Arc to start:
oc apply -f arc-deployment.yaml
oc -n monitoring get pods -w
Once it's running, grab the admin token:
oc -n monitoring logs deployment/arc | grep "Initial admin"You'll see something like:
Initial admin API token: arc_xxxxxxxxxxxxxxxxxxxxxxxxxxxxx
Save this token. You'll need it for both Telegraf configurations and Grafana.
Step 2: Deploy Telegraf for Metrics (DaemonSet)
This is the same DaemonSet pattern from our Kubernetes monitoring tutorial. If you've done that before, this will feel familiar. If not—a DaemonSet ensures one Telegraf pod runs on every node, automatically scaling with your cluster.
RBAC
Telegraf needs permission to read Kubernetes metrics. Create telegraf-metrics-rbac.yaml:
apiVersion: v1
kind: ServiceAccount
metadata:
  name: telegraf-metrics
  namespace: monitoring
---
apiVersion: rbac.authorization.k8s.io/v1
kind: ClusterRole
metadata:
  name: telegraf-metrics
rules:
  - apiGroups: [""]
    resources:
      - nodes
      - nodes/proxy
      - nodes/stats
      - pods
      - services
      - endpoints
    verbs: ["get", "list", "watch"]
  - apiGroups: ["apps"]
    resources:
      - deployments
      - daemonsets
      - replicasets
      - statefulsets
    verbs: ["get", "list", "watch"]
  - nonResourceURLs:
      - /metrics
    verbs: ["get"]
---
apiVersion: rbac.authorization.k8s.io/v1
kind: ClusterRoleBinding
metadata:
  name: telegraf-metrics
roleRef:
  apiGroup: rbac.authorization.k8s.io
  kind: ClusterRole
  name: telegraf-metrics
subjects:
  - kind: ServiceAccount
    name: telegraf-metrics
    namespace: monitoring
What's RBAC? Role-Based Access Control defines what Telegraf can see in your cluster. The ClusterRole lists the resources it can read (nodes, pods, etc.), and the ClusterRoleBinding connects that role to Telegraf's ServiceAccount.
Configuration
Create telegraf-metrics-config.yaml:
apiVersion: v1
kind: ConfigMap
metadata:
  name: telegraf-metrics-config
  namespace: monitoring
data:
  telegraf.conf: |
    [agent]
      interval = "10s"
      round_interval = true
      metric_batch_size = 1000
      metric_buffer_limit = 10000
      flush_interval = "10s"
      hostname = "$HOSTNAME"
      omit_hostname = false

    # Arc output plugin
    [[outputs.arc]]
      url = "http://arc.monitoring.svc.cluster.local:8000/api/v1/write/msgpack"
      api_key = "$ARC_TOKEN"
      database = "openshift"
      content_encoding = "gzip"

    # Kubernetes metrics from Kubelet
    [[inputs.kubernetes]]
      url = "https://$HOSTIP:10250"
      bearer_token = "/var/run/secrets/kubernetes.io/serviceaccount/token"
      insecure_skip_verify = true

    # Node-level system metrics
    [[inputs.cpu]]
      percpu = false
      totalcpu = true
      collect_cpu_time = false

    [[inputs.mem]]

    [[inputs.disk]]
      ignore_fs = ["tmpfs", "devtmpfs", "devfs", "iso9660", "overlay", "aufs", "squashfs"]

    [[inputs.diskio]]

    [[inputs.net]]
      ignore_protocol_stats = true

    [[inputs.system]]
DaemonSet
Create telegraf-metrics-daemonset.yaml:
apiVersion: v1
kind: Secret
metadata:
  name: telegraf-metrics-secrets
  namespace: monitoring
type: Opaque
stringData:
  arc-token: "arc_xxxxxxxxxxxxxxxxxxxxxxxxxxxxx"  # Replace with your Arc token
---
apiVersion: apps/v1
kind: DaemonSet
metadata:
  name: telegraf-metrics
  namespace: monitoring
spec:
  selector:
    matchLabels:
      app: telegraf-metrics
  template:
    metadata:
      labels:
        app: telegraf-metrics
    spec:
      serviceAccountName: telegraf-metrics
      containers:
        - name: telegraf
          image: telegraf:1.33
          env:
            - name: HOSTNAME
              valueFrom:
                fieldRef:
                  fieldPath: spec.nodeName
            - name: HOSTIP
              valueFrom:
                fieldRef:
                  fieldPath: status.hostIP
            - name: ARC_TOKEN
              valueFrom:
                secretKeyRef:
                  name: telegraf-metrics-secrets
                  key: arc-token
            - name: HOST_PROC
              value: /hostfs/proc
            - name: HOST_SYS
              value: /hostfs/sys
            - name: HOST_ETC
              value: /hostfs/etc
            - name: HOST_MOUNT_PREFIX
              value: /hostfs
          volumeMounts:
            - name: config
              mountPath: /etc/telegraf
            - name: hostfs-proc
              mountPath: /hostfs/proc
              readOnly: true
            - name: hostfs-sys
              mountPath: /hostfs/sys
              readOnly: true
          resources:
            requests:
              memory: "128Mi"
              cpu: "100m"
            limits:
              memory: "256Mi"
              cpu: "500m"
      volumes:
        - name: config
          configMap:
            name: telegraf-metrics-config
        - name: hostfs-proc
          hostPath:
            path: /proc
        - name: hostfs-sys
          hostPath:
            path: /sys
The volume mounts (/hostfs/proc, /hostfs/sys) give Telegraf access to the host's metrics, not just the container's. On OpenShift, you'll need the privileged SCC for this:
oc adm policy add-scc-to-serviceaccount -n monitoring -z telegraf-metrics privilegedImportant: Replace arc_xxxxxxxxxxxxxxxxxxxxxxxxxxxxx with your actual Arc token from Step 1.
Apply everything:
oc apply -f telegraf-metrics-rbac.yaml
oc apply -f telegraf-metrics-config.yaml
oc apply -f telegraf-metrics-daemonset.yaml
Check that one Telegraf pod is running per node:
oc -n monitoring get pods -l app=telegraf-metrics -o wideStep 3: Deploy Telegraf for Logs (Deployment)
The log receiver is simpler—a single Deployment that listens for syslog from the Cluster Logging Operator. No DaemonSet needed, no host mounts, no privileged SCC.
Create telegraf-logs-config.yaml:
apiVersion: v1
kind: ConfigMap
metadata:
  name: telegraf-logs-config
  namespace: monitoring
data:
  telegraf.conf: |
    [agent]
      interval = "10s"
      flush_interval = "5s"
      hostname = ""
      omit_hostname = false

    # Syslog input - receives logs from ClusterLogForwarder
    [[inputs.syslog]]
      server = "tcp://:6514"
      best_effort = true
      syslog_standard = "RFC5424"

    # Arc output
    [[outputs.arc]]
      url = "http://arc.monitoring.svc.cluster.local:8000/api/v1/write/msgpack"
      api_key = "$ARC_TOKEN"
      database = "openshift"
      content_encoding = "gzip"
Create telegraf-logs-deployment.yaml:
apiVersion: v1
kind: Secret
metadata:
  name: telegraf-logs-secrets
  namespace: monitoring
type: Opaque
stringData:
  arc-token: "arc_xxxxxxxxxxxxxxxxxxxxxxxxxxxxx"  # Replace with your Arc token
---
apiVersion: apps/v1
kind: Deployment
metadata:
  name: telegraf-logs
  namespace: monitoring
spec:
  replicas: 1
  selector:
    matchLabels:
      app: telegraf-logs
  template:
    metadata:
      labels:
        app: telegraf-logs
    spec:
      containers:
        - name: telegraf
          image: telegraf:1.33
          ports:
            - containerPort: 6514
              protocol: TCP
          env:
            - name: ARC_TOKEN
              valueFrom:
                secretKeyRef:
                  name: telegraf-logs-secrets
                  key: arc-token
          volumeMounts:
            - name: config
              mountPath: /etc/telegraf
          resources:
            requests:
              memory: "128Mi"
              cpu: "100m"
            limits:
              memory: "512Mi"
              cpu: "500m"
      volumes:
        - name: config
          configMap:
            name: telegraf-logs-config
---
apiVersion: v1
kind: Service
metadata:
  name: telegraf-syslog
  namespace: monitoring
spec:
  selector:
    app: telegraf-logs
  ports:
    - name: syslog
      port: 6514
      targetPort: 6514
      protocol: TCP
The Service creates telegraf-syslog.monitoring.svc.cluster.local:6514—this is the address the ClusterLogForwarder will send logs to.
If your cluster enforces NetworkPolicies, you'll need to allow traffic from the openshift-logging namespace. Create network-policy.yaml:
apiVersion: networking.k8s.io/v1
kind: NetworkPolicy
metadata:
  name: allow-clf-to-telegraf
  namespace: monitoring
spec:
  podSelector:
    matchLabels:
      app: telegraf-logs
  ingress:
    - from:
        - namespaceSelector:
            matchLabels:
              kubernetes.io/metadata.name: openshift-logging
      ports:
        - protocol: TCP
          port: 6514
Apply:
oc apply -f telegraf-logs-config.yaml
oc apply -f telegraf-logs-deployment.yaml
oc apply -f network-policy.yaml
Step 4: Configure ClusterLogForwarder
Now the OpenShift-specific part. The ClusterLogForwarder CR tells the Logging Operator where to send logs. We're routing them to our Telegraf syslog listener.
What's a ClusterLogForwarder? It's a Custom Resource that acts as a routing table for your log streams. You define outputs (where to send) and pipelines (which log types go to which outputs). The Logging Operator's collector (Vector or Fluentd, depending on your OCP version) handles the actual forwarding.
Create cluster-log-forwarder.yaml:
apiVersion: logging.openshift.io/v1
kind: ClusterLogForwarder
metadata:
  name: instance
  namespace: openshift-logging
spec:
  outputs:
    - name: arc-via-telegraf
      type: syslog
      syslog:
        facility: user
        rfc: RFC5424
        payloadKey: message
        severity: informational
      url: tcp://telegraf-syslog.monitoring.svc.cluster.local:6514
  pipelines:
    - name: application-logs
      inputRefs:
        - application
      outputRefs:
        - arc-via-telegraf
    - name: infrastructure-logs
      inputRefs:
        - infrastructure
      outputRefs:
        - arc-via-telegraf
A few important details:
- The CR must be named
instancein theopenshift-loggingnamespace. This is a CLO v1 restriction—only one ClusterLogForwarder per cluster. Miss this naming and CLO silently ignores it. Ask me how I know. inputRefsdefines which log streams to forward.applicationis your workload pods.infrastructureis control plane components (etcd, kube-apiserver, openshift-* namespaces). There's alsoauditfor API server audit logs, but that requires additional RBAC and generates significant volume—save it for later.payloadKey: messageputs the full log message in the syslog message field, which is how Telegraf's syslog input expects it.
Apply:
oc apply -f cluster-log-forwarder.yamlGive it a minute for the Logging Operator to reconcile. Check the status:
oc -n openshift-logging get clusterlogforwarder instance -o jsonpath='{.status.conditions}' | python3 -m json.toolYou should see a condition with type: Ready and status: "True".
Step 5: Verify Everything
Three layers to check. If any layer is broken, data stops flowing.
1. Check the ClusterLogForwarder is accepted:
oc -n openshift-logging get clusterlogforwarder instanceStatus should show Ready.
2. Check both Telegraf instances:
# Metrics DaemonSet
oc -n monitoring logs daemonset/telegraf-metrics --tail=10

# Logs Deployment
oc -n monitoring logs deployment/telegraf-logs --tail=10
You should see output about syslog input listening and metrics being flushed to Arc.
3. Query Arc to confirm data from both paths:
Port-forward to Arc:
oc -n monitoring port-forward svc/arc 8000:8000In another terminal:
export ARC_TOKEN="arc_xxxxxxxxxxxxxxxxxxxxxxxxxxxxx"

# Check which tables exist
curl -s -X POST http://localhost:8000/api/v1/query \
  -H "Authorization: Bearer $ARC_TOKEN" \
  -H "Content-Type: application/json" \
  -d '{"sql": "SHOW TABLES FROM openshift"}'
You should see tables from both paths:
{
  "columns": ["name"],
  "data": [
    ["cpu"],
    ["disk"],
    ["diskio"],
    ["kubernetes_node"],
    ["kubernetes_pod_container"],
    ["kubernetes_pod_network"],
    ["kubernetes_pod_volume"],
    ["kubernetes_system_container"],
    ["mem"],
    ["net"],
    ["syslog"],
    ["system"]
  ]
}
syslog is from the log path. Everything else is from the metrics DaemonSet. Both in one database.
Quick spot-check on each:
# Check logs
curl -s -X POST http://localhost:8000/api/v1/query \
  -H "Authorization: Bearer $ARC_TOKEN" \
  -H "Content-Type: application/json" \
  -d '{"sql": "SELECT time, hostname, appname, severity, message FROM openshift.syslog ORDER BY time DESC LIMIT 5"}'

# Check metrics
curl -s -X POST http://localhost:8000/api/v1/query \
  -H "Authorization: Bearer $ARC_TOKEN" \
  -H "Content-Type: application/json" \
  -d '{"sql": "SELECT time, host, usage_idle FROM openshift.cpu ORDER BY time DESC LIMIT 5"}'
If both return data, you're in business.
Step 6: Grafana Dashboards
Now the payoff—visualizing logs and metrics side by side.
Deploy Grafana
Create grafana-deployment.yaml:
apiVersion: v1
kind: PersistentVolumeClaim
metadata:
  name: grafana-data
  namespace: monitoring
spec:
  accessModes:
    - ReadWriteOnce
  resources:
    requests:
      storage: 5Gi
---
apiVersion: apps/v1
kind: Deployment
metadata:
  name: grafana
  namespace: monitoring
spec:
  replicas: 1
  selector:
    matchLabels:
      app: grafana
  template:
    metadata:
      labels:
        app: grafana
    spec:
      securityContext:
        fsGroup: 472
      containers:
        - name: grafana
          image: grafana/grafana:latest
          ports:
            - containerPort: 3000
          env:
            - name: GF_SECURITY_ADMIN_USER
              value: "admin"
            - name: GF_SECURITY_ADMIN_PASSWORD
              value: "admin"
            - name: GF_PLUGINS_ALLOW_LOADING_UNSIGNED_PLUGINS
              value: "basekick-arc-datasource"
          volumeMounts:
            - name: grafana-storage
              mountPath: /var/lib/grafana
          resources:
            requests:
              memory: "256Mi"
              cpu: "250m"
      volumes:
        - name: grafana-storage
          persistentVolumeClaim:
            claimName: grafana-data
---
apiVersion: v1
kind: Service
metadata:
  name: grafana
  namespace: monitoring
spec:
  selector:
    app: grafana
  ports:
    - port: 3000
      targetPort: 3000
Apply it and expose via an OpenShift Route (this is the OpenShift way—no NodePort gymnastics):
oc apply -f grafana-deployment.yaml
oc -n monitoring expose svc/grafana
oc -n monitoring get route grafana
The route gives you a URL like grafana-monitoring.apps.your-cluster.com.
Install Arc Datasource
Exec into the Grafana pod and install the plugin:
oc -n monitoring exec -it deployment/grafana -- /bin/sh
wget https://github.com/basekick-labs/grafana-arc-datasource/releases/download/v1.1.0/basekick-arc-datasource-1.1.0.zip
unzip basekick-arc-datasource-1.1.0.zip -d /var/lib/grafana/plugins/
exit

oc -n monitoring rollout restart deployment/grafana
Then in Grafana: Connections → Data sources → Add data source → search Arc:
- URL:
http://arc.monitoring.svc.cluster.local:8000 - API Key: Your Arc token
- Database:
openshift
Click Save & Test. You should see "Data source is working".
Metrics Dashboards
Cluster CPU by node:
SELECT
  time_bucket(INTERVAL '$__interval', time) as time,
  host,
  100 - AVG(usage_idle) AS cpu_usage
FROM openshift.cpu
WHERE $__timeFilter(time)
GROUP BY time_bucket(INTERVAL '$__interval', time), host
ORDER BY time ASC
Memory by namespace:
SELECT
  time_bucket(INTERVAL '$__interval', time) as time,
  namespace,
  SUM(memory_working_set_bytes) / 1024 / 1024 / 1024 AS memory_gb
FROM openshift.kubernetes_pod_container
WHERE $__timeFilter(time)
GROUP BY time_bucket(INTERVAL '$__interval', time), namespace
ORDER BY time ASC
Top 10 pods by CPU:
SELECT
  pod_name,
  namespace,
  AVG(cpu_usage_nanocores) / 1000000 AS cpu_millicores
FROM openshift.kubernetes_pod_container
WHERE $__timeFilter(time)
GROUP BY pod_name, namespace
ORDER BY cpu_millicores DESC
LIMIT 10
Disk usage by node:
SELECT
  time_bucket(INTERVAL '$__interval', time) as time,
  host,
  AVG(used_percent) AS disk_used_percent
FROM openshift.disk
WHERE $__timeFilter(time)
GROUP BY time_bucket(INTERVAL '$__interval', time), host
ORDER BY time ASC
Log Dashboards
Error rate over time:
SELECT
  time_bucket(INTERVAL '$__interval', time) as time,
  COUNT(*) as total_logs,
  COUNT(CASE WHEN severity IN ('err', 'crit', 'alert', 'emerg') THEN 1 END) as errors
FROM openshift.syslog
WHERE $__timeFilter(time)
GROUP BY time_bucket(INTERVAL '$__interval', time)
ORDER BY time ASC
Top noisy pods:
SELECT
  appname,
  COUNT(*) as log_count,
  COUNT(CASE WHEN severity = 'err' THEN 1 END) as error_count
FROM openshift.syslog
WHERE $__timeFilter(time)
GROUP BY appname
ORDER BY log_count DESC
LIMIT 20
Find OOMKilled events:
SELECT time, hostname, appname, message
FROM openshift.syslog
WHERE $__timeFilter(time)
  AND severity IN ('err', 'crit')
  AND message LIKE '%OOMKilled%'
ORDER BY time DESC
LIMIT 100
Log volume trend (detect log storms):
SELECT
  time_bucket(INTERVAL '1 hour', time) as hour,
  COUNT(*) as events
FROM openshift.syslog
WHERE $__timeFilter(time)
GROUP BY hour
ORDER BY hour ASC
Infrastructure vs application logs:
SELECT
  time_bucket(INTERVAL '1 hour', time) as hour,
  COUNT(CASE WHEN appname LIKE 'etcd%' OR appname LIKE 'kube-%'
    OR appname LIKE 'openshift-%' THEN 1 END) as infra_logs,
  COUNT(CASE WHEN appname NOT LIKE 'etcd%' AND appname NOT LIKE 'kube-%'
    AND appname NOT LIKE 'openshift-%' THEN 1 END) as app_logs
FROM openshift.syslog
WHERE $__timeFilter(time)
GROUP BY hour
ORDER BY hour ASC
The Killer Query: Logs + Metrics Correlated
This is the part you can't do when your metrics live in Prometheus and your logs live in Loki. One database means you can join them:
-- Find pods with high CPU AND frequent errors in the same time window
WITH high_cpu AS (
  SELECT
    pod_name,
    namespace,
    AVG(cpu_usage_nanocores) / 1000000 AS avg_cpu_millicores
  FROM openshift.kubernetes_pod_container
  WHERE time > NOW() - INTERVAL '1 hour'
  GROUP BY pod_name, namespace
  HAVING AVG(cpu_usage_nanocores) / 1000000 > 500
),
error_logs AS (
  SELECT
    appname,
    COUNT(*) as error_count
  FROM openshift.syslog
  WHERE time > NOW() - INTERVAL '1 hour'
    AND severity IN ('err', 'crit')
  GROUP BY appname
  HAVING COUNT(*) > 10
)
SELECT
  h.pod_name,
  h.namespace,
  h.avg_cpu_millicores,
  e.error_count
FROM high_cpu h
JOIN error_logs e ON h.pod_name = e.appname
ORDER BY h.avg_cpu_millicores DESC
High CPU and high error rate? That's your problem pod. One query, one database. Try doing that with PromQL and LogQL in the same Grafana panel.
Why Not the Old Stack?
I'm not here to trash anyone's tools. But if you're evaluating options—especially if you're being forced to migrate off EFK—here's the honest picture.
EFK is dead. Red Hat deprecated it in OCP 4.13 and ended support. If you're still running it, you're on borrowed time. You need to migrate somewhere.
LokiStack is the official replacement, but it's complex. Five or more components to deploy and manage. And in our benchmark of six log databases, Loki silently dropped 98% of logs under sustained load while returning HTTP 204 success responses. At high log volumes, the numbers you see at the API level may not reflect what actually gets stored.
Prometheus handles metrics well, but it's another system. Cardinality limits bite when you have hundreds of pods with dynamic labels. PromQL has a learning curve. And anything beyond two weeks of retention means bolting on Thanos or Cortex—two more systems to manage.
Graylog needs Elasticsearch or OpenSearch under the hood. You're back to the EFK resource footprint, just with a different frontend.
Arc handles both logs and metrics in one place. Standard SQL instead of three different query languages. Portable Parquet files instead of proprietary storage. If Loki and Prometheus work for your scale, genuinely—keep using them. But if you're evaluating alternatives or migrating off EFK, this stack is worth a serious look.
Storage and Retention
OpenShift infrastructure logs are verbose. A production cluster can generate gigabytes per day. Two things help:
Retention policies. Set automatic cleanup so you're not storing logs forever:
curl -X POST http://localhost:8000/api/v1/retention \
  -H "Authorization: Bearer $ARC_TOKEN" \
  -H "Content-Type: application/json" \
  -d '{
    "database": "openshift",
    "measurement": "syslog",
    "retention_days": 30
  }'
Compression. Arc stores data in Parquet format with automatic compression. A cluster generating 10GB of raw logs per day stores roughly 2-3GB. For a 30-day retention window, that's 60-90GB—manageable on a single PVC.
For larger clusters, switch to S3-compatible storage:
env:
  - name: STORAGE_BACKEND
    value: "s3"
  - name: S3_BUCKET
    value: "openshift-observability"
  - name: S3_ENDPOINT
    value: "https://s3.amazonaws.com"
Conclusion
You now have a complete OpenShift observability stack:
- Telegraf DaemonSet collecting node and pod metrics from every node
- ClusterLogForwarder shipping application and infrastructure logs via syslog
- Telegraf Deployment receiving those logs and writing to Arc
- Arc storing everything—logs and metrics—in one database
- Grafana visualizing it all with SQL dashboards
The same query language for logs and metrics. The same storage format. No fleet of microservices to manage.
If you're running vanilla Kubernetes (not OpenShift), check out our Kubernetes monitoring tutorial—same Telegraf + Arc + Grafana pattern, simpler setup without the CLO layer.
Resources: