Monitor Your Proxmox Cluster with Telegraf, Arc, and Grafana

Proxmox is fantastic for running VMs and containers. The built-in web UI gives you basic graphs for CPU, memory, and network, enough to know if something is on fire. But when you need to understand resource trends over weeks, compare VM performance, or get alerted before your storage fills up, you need something better.
I run Proxmox for my homelab and for some production workloads. After trying various monitoring setups, I settled on Telegraf + Arc + Grafana. Telegraf collects the metrics, Arc stores them efficiently (even months of data stays fast to query), and Grafana gives you dashboards and alerts.
Let's build it.
The Architecture
┌─────────────────────────────────────────────────────────────┐
│                    Proxmox Cluster                          │
│                                                             │
│  ┌────────────┐  ┌────────────┐  ┌────────────┐             │
│  │   Node 1   │  │   Node 2   │  │   Node 3   │             │
│  │ (pve1)     │  │ (pve2)     │  │ (pve3)     │             │
│  │            │  │            │  │            │             │
│  │ VMs / LXCs │  │ VMs / LXCs │  │ VMs / LXCs │             │
│  └─────┬──────┘  └─────┬──────┘  └─────┬──────┘             │
│        │               │               │                    │
│        └───────────────┼───────────────┘                    │
│                        ▼                                    │
│              ┌─────────────────┐                            │
│              │    Telegraf     │  (one per node)            │
│              │  proxmox input  │                            │
│              └────────┬────────┘                            │
│                       │                                     │
└───────────────────────┼─────────────────────────────────────┘
                        │
                        ▼
               ┌─────────────────┐
               │      Arc        │
               │   Port 8000     │
               └────────┬────────┘
                        │
                        ▼
               ┌─────────────────┐
               │    Grafana      │
               │   Port 3000     │
               └─────────────────┘
One important detail up front, because it shapes the whole setup: the Telegraf Proxmox plugin is node-scoped, not cluster-scoped. It talks to /nodes/{node}/qemu and /nodes/{node}/lxc on a single node, and it does not use /cluster/resources. So a single Telegraf instance only ever reports the guests running on one node.
If you have a three-node cluster, you run three Telegraf instances (one per node, or one per node pointed at a different base_url). Plan for that now rather than wondering later why two-thirds of your VMs never showed up.
What the Plugin Actually Collects
This is the part most tutorials get wrong, so let's be precise. The plugin emits a single measurement called proxmox, not one measurement per resource type. Every VM and container lands in the same table, distinguished by tags.
Tags:
| Tag | Description |
|---|---|
vm_name | Guest name (e.g. web-01) |
vm_type | qemu or lxc |
vm_fqdn | Guest name + search domain |
node_fqdn | The Proxmox node reporting the guest |
host | Hostname of the machine running Telegraf |
vm_id | VMID (only if you opt in, see below) |
Fields:
| Field | Description |
|---|---|
status | running, stopped, … |
uptime | Guest uptime in seconds |
cpuload | CPU usage as a fraction (0.0–1.0), not a percentage |
mem_used, mem_total, mem_free | Memory in bytes |
mem_used_percentage | Memory used, already as a percentage |
swap_used, swap_total, swap_free, swap_used_percentage | Swap |
disk_used, disk_total, disk_free | Disk in bytes |
disk_used_percentage | Disk used, already as a percentage |
Two things worth internalizing:
cpuloadis a fraction. Multiply by 100 for a percentage. The*_percentagefields are already scaled, so don't multiply those.- There are no node-level or storage-pool metrics. The plugin reports guests, full stop. No node CPU, no ZFS pool usage, no datastore capacity. If you want those, see Filling the Gaps below.
vm_id and status are fields by default. You can promote them to tags with additional_vmstats_tags, which makes them cheaper to filter and group on:
additional_vmstats_tags = ["vmid"]Do not add "status" to that list when writing to Arc. Promoting status to a tag leaves it as both a tag and a field, and Arc's MessagePack writer rejects the whole batch with a name collision:
E! [outputs.arc] column "status" has 10 entries (expect 5); potential field and tag name collision
Nothing gets written and it is not obvious why. status works fine as a plain field. You can still filter and group on it in SQL, as the queries below do.
Prerequisites
- A Proxmox cluster (or single node)
- A VM, LXC, or separate machine to run the monitoring stack
- A Proxmox API token for Telegraf
- Telegraf 1.37 or newer. The Arc output plugin ships in 1.37+
Create a Proxmox API Token
First, create a dedicated user and API token for monitoring. In the Proxmox web UI:
-
Datacenter → Permissions → Users → Add
- User name:
telegraf - Realm:
pve(orpamif you prefer) - No password needed (API token only)
- User name:
-
Datacenter → Permissions → API Tokens → Add
- User:
telegraf@pve - Token ID:
monitoring - Privilege Separation: checked
- Note the token secret, you'll need it
- User:
-
Datacenter → Permissions → Add → User Permission
- Path:
/ - User:
telegraf@pve - Role:
PVEAuditor
- Path:
The PVEAuditor role gives read-only access to all cluster information, exactly what we need for monitoring.
Or via CLI on any Proxmox node:
# Create user
pveum user add telegraf@pve

# Create API token (save the output!)
pveum user token add telegraf@pve monitoring --privsep=1

# Grant read access to the entire cluster
pveum aclmod / -user telegraf@pve -role PVEAuditor
Docker Compose Setup
Create a docker-compose.yml for the monitoring stack:
services:
  arc:
    image: ghcr.io/basekick-labs/arc:latest
    container_name: arc
    restart: unless-stopped
    environment:
      ARC_STORAGE_BACKEND: "local"
      ARC_WAL_ENABLED: "true"
      # Pre-set the admin token so you don't have to scrape it from the logs.
      # Must be at least 32 characters or Arc refuses to create it.
      ARC_AUTH_BOOTSTRAP_TOKEN: "${ARC_TOKEN}"
    volumes:
      - arc-data:/app/data
    ports:
      - "8000:8000"

  telegraf:
    image: telegraf:1.37
    container_name: telegraf
    restart: unless-stopped
    volumes:
      - ./telegraf.conf:/etc/telegraf/telegraf.conf:ro
    environment:
      PROXMOX_URL: "https://your-proxmox-node:8006/api2/json"
      PROXMOX_TOKEN: "telegraf@pve!monitoring=your-token-secret-here"
      ARC_TOKEN: "${ARC_TOKEN}"
    depends_on:
      - arc

  grafana:
    image: grafana/grafana:latest
    container_name: grafana
    restart: unless-stopped
    environment:
      GF_SECURITY_ADMIN_PASSWORD: "admin"
      GF_INSTALL_PLUGINS: "https://github.com/basekick-labs/grafana-arc-datasource/releases/download/v1.2.0/basekick-arc-datasource-1.2.0.zip;basekick-arc-datasource"
      GF_PLUGINS_ALLOW_LOADING_UNSIGNED_PLUGINS: "basekick-arc-datasource"
    volumes:
      - grafana-data:/var/lib/grafana
    ports:
      - "3000:3000"
    depends_on:
      - arc

volumes:
  arc-data:
  grafana-data:
Set your token once in a .env file next to the compose file:
# Must be >= 32 characters
echo "ARC_TOKEN=$(openssl rand -hex 24)" > .env
Three details that will bite you otherwise:
base_urlneeds the/api2/jsonsuffix. Pointing it athttps://node:8006alone will not work.- The Arc bootstrap token must be at least 32 characters. A shorter one fails with
bootstrap token must be at least 32 characters long, Arc starts anyway with no token, and every write returns 401. - The Arc Grafana datasource is unsigned, so
GF_PLUGINS_ALLOW_LOADING_UNSIGNED_PLUGINSis required. Without it Grafana downloads the plugin and then refuses to load it. Recent Grafana also warns thatGF_INSTALL_PLUGINSis deprecated in favour ofGF_PLUGINS_PREINSTALL; it still works today, but expect to switch eventually.
Telegraf Configuration
Create telegraf.conf:
[agent]
  interval = "30s"
  round_interval = true
  flush_interval = "10s"
  omit_hostname = false

# Proxmox VE input plugin
[[inputs.proxmox]]
  ## Note the /api2/json suffix (required).
  base_url = "${PROXMOX_URL}"

  ## Format: USER@REALM!TOKENID=SECRET
  api_token = "${PROXMOX_TOKEN}"

  ## The node this Telegraf instance reports on. If empty, the plugin uses
  ## the hostname of the machine Telegraf runs on, which is wrong when
  ## Telegraf runs in a container. Set it explicitly.
  node_name = "pve1"

  ## Skip TLS verification (for self-signed certs)
  insecure_skip_verify = true

  response_timeout = "10s"

  ## Promote vmid to a tag. Do NOT add "status" here; it collides with the
  ## status field and Arc will reject the batch.
  additional_vmstats_tags = ["vmid"]

# Arc output
[[outputs.arc]]
  url = "http://arc:8000/api/v1/write/msgpack"
  api_key = "${ARC_TOKEN}"
  database = "proxmox"
  content_encoding = "gzip"
node_name deserves emphasis. When it's unset the plugin falls back to the hostname of the machine Telegraf runs on, which inside a container is a random hex string that matches no Proxmox node. You get an empty result set and no obvious error. Set it explicitly to the node you're pointing at.
For a multi-node cluster, add one [[inputs.proxmox]] block per node, each with its own base_url and node_name.
Start the Stack
docker compose up -dCheck that metrics are flowing. Arc targets a database with the x-arc-database header, and you query measurements by bare name:
source .env

curl -s -X POST http://localhost:8000/api/v1/query \
  -H "Authorization: Bearer $ARC_TOKEN" \
  -H "x-arc-database: proxmox" \
  -H "Content-Type: application/json" \
  -d '{"sql": "SELECT vm_type, vm_name, status FROM proxmox LIMIT 5", "format": "json"}'
You should see something like:
vm_type | vm_name | status
lxc     | dns     | running
lxc     | proxy   | running
qemu    | web-01  | running
qemu    | db-01   | running
qemu    | backup  | stopped
If you get zero rows, check docker logs telegraf. The two most common causes are a wrong node_name and a missing /api2/json suffix, both of which fail quietly.
Configure Grafana
Arc has a native Grafana datasource that uses Arc's Arrow endpoint for efficient columnar transfer. Use that, not a generic SQL plugin.
-
Open Grafana at
http://localhost:3000(admin/admin) -
Add Arc as a data source:
- Go to Connections → Data sources → Add data source
- Search for Arc
- URL:
http://arc:8000 - API Key: your Arc token
- Database:
proxmox
If you'd rather provision it as code, note that the Arc datasource reads its URL from jsonData.url, not the top-level url field that most Grafana datasources use. Setting only the outer url leaves the plugin with an empty address and every query fails with unsupported protocol scheme "":
apiVersion: 1
datasources:
  - name: Arc
    type: basekick-arc-datasource
    access: proxy
    url: http://arc:8000
    jsonData:
      url: http://arc:8000      # <- the one the plugin actually reads
      database: proxmox
      useArrow: true
    secureJsonData:
      apiKey: $ARC_TOKEN
One cosmetic wrinkle in the current plugin release: the Save & test button issues SHOW DATABASES against Arc's Arrow endpoint, which rejects it (SHOW DATABASES is not supported on the Arrow endpoint). The health check shows an error even though the datasource is fine. Build a panel and you'll see data. Don't chase it.
The datasource supports the macros you'd expect:
| Macro | Description |
|---|---|
$__timeFilter(column) | Expands to the panel's time range filter |
$__timeFrom() / $__timeTo() | Range bounds |
$__interval | Grafana's calculated bucket width |
Sample Queries
Every query below was run against a live Arc instance receiving real Proxmox plugin output. Note the recurring shapes: cpuload * 100 for a percentage, mem_used_percentage used as-is, and DISTINCT ON (vm_id) to collapse a time series down to each guest's most recent sample.
Here's what they look like assembled into a dashboard. Every panel below is one of the queries from this section:
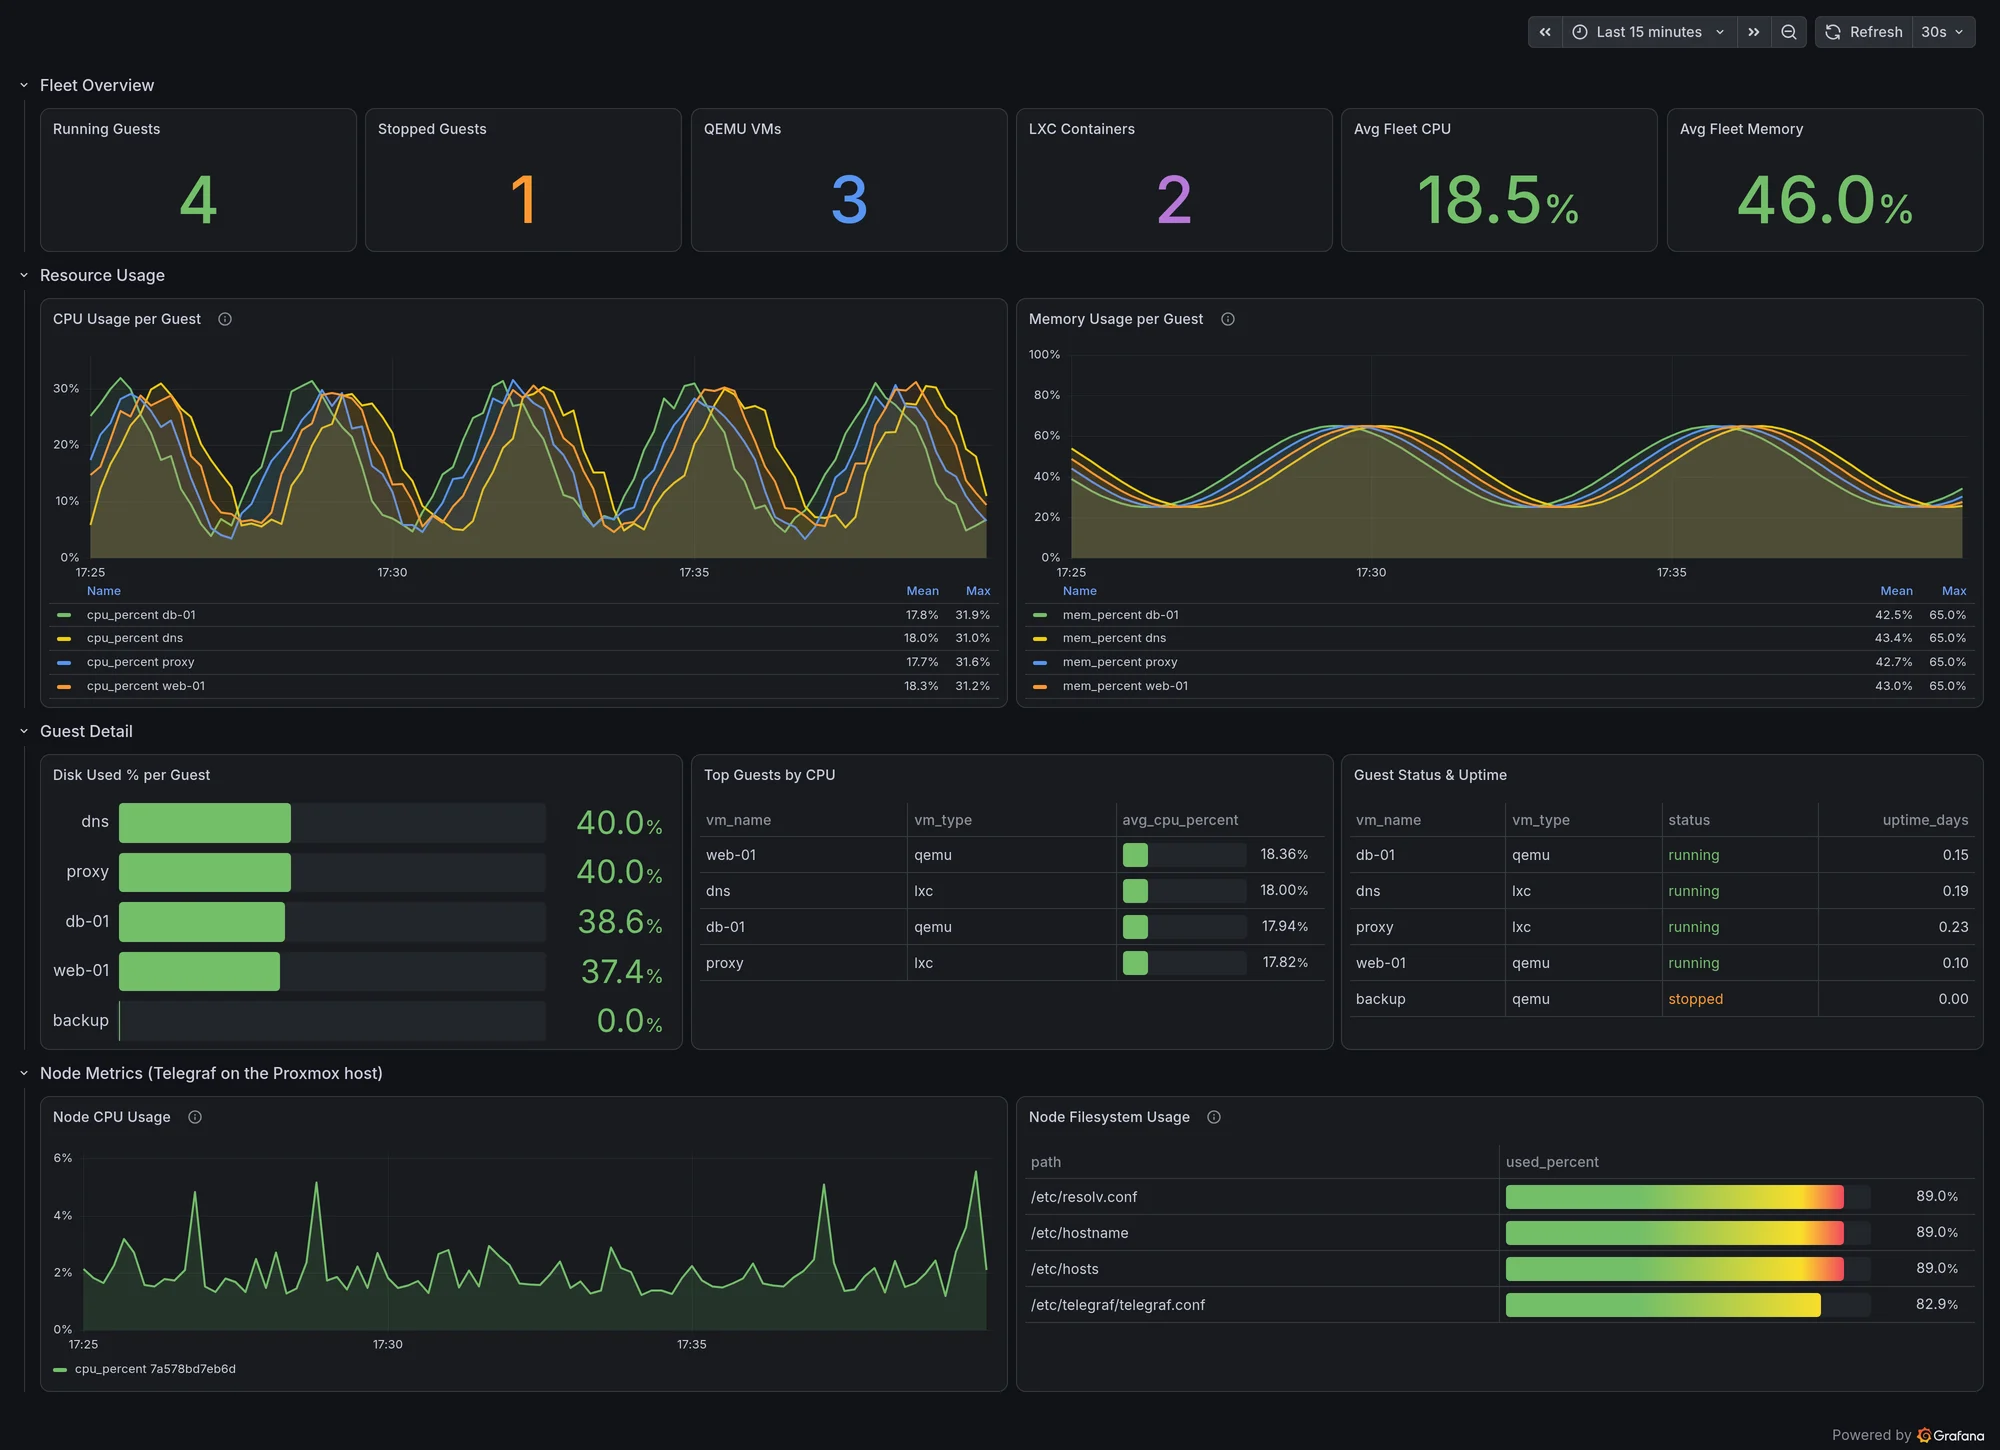
A few things worth noticing in that screenshot, because they're behaviors of the data rather than the dashboard: backup sits at 0.0% disk and 0.00 uptime because it's a stopped VM and the plugin reports zeros rather than omitting it, and the node-level panels at the bottom come from a second Telegraf instance, since the Proxmox plugin alone can't fill them. Both are covered below.
CPU Usage per Guest
SELECT
  time_bucket(INTERVAL '$__interval', time) AS time,
  vm_name,
  AVG(cpuload) * 100 AS cpu_percent
FROM proxmox
WHERE $__timeFilter(time)
  AND status = 'running'
GROUP BY time_bucket(INTERVAL '$__interval', time), vm_name
ORDER BY time ASC
Memory Usage per Guest
mem_used_percentage is already a percentage, so no arithmetic is needed.
SELECT
  time_bucket(INTERVAL '$__interval', time) AS time,
  vm_name,
  AVG(mem_used_percentage) AS mem_percent
FROM proxmox
WHERE $__timeFilter(time)
GROUP BY time_bucket(INTERVAL '$__interval', time), vm_name
ORDER BY time ASC
Top 10 Guests by CPU
SELECT
  vm_name,
  vm_type,
  AVG(cpuload) * 100 AS avg_cpu_percent
FROM proxmox
WHERE $__timeFilter(time)
  AND status = 'running'
GROUP BY vm_name, vm_type
ORDER BY avg_cpu_percent DESC
LIMIT 10
Disk Usage per Guest
SELECT
  vm_name,
  vm_type,
  MAX(disk_used_percentage) AS disk_percent,
  MAX(disk_total) / 1024 / 1024 / 1024 AS disk_gb
FROM proxmox
WHERE $__timeFilter(time)
GROUP BY vm_name, vm_type
ORDER BY disk_percent DESC
Guest Status Summary
DISTINCT ON (vm_id) takes the most recent sample per guest, so each guest is counted once regardless of how many samples fall in the window.
SELECT status, COUNT(*) AS guests
FROM (
  SELECT DISTINCT ON (vm_id) vm_id, status
  FROM proxmox
  WHERE time > NOW() - INTERVAL '10 minutes'
  ORDER BY vm_id, time DESC
)
GROUP BY status
ORDER BY guests DESC
status | guests
running | 4
stopped | 1
Running Guests per Node
SELECT node_fqdn, COUNT(DISTINCT vm_id) AS running_guests
FROM (
  SELECT DISTINCT ON (vm_id) vm_id, node_fqdn, status
  FROM proxmox
  WHERE time > NOW() - INTERVAL '10 minutes'
  ORDER BY vm_id, time DESC
)
WHERE status = 'running'
GROUP BY node_fqdn
Guest Uptime
SELECT
  vm_name,
  vm_type,
  MAX(uptime) / 86400.0 AS uptime_days
FROM proxmox
WHERE time > NOW() - INTERVAL '10 minutes'
  AND status = 'running'
GROUP BY vm_name, vm_type
ORDER BY uptime_days DESC
Dashboard Variable
For a vm_name dropdown:
SELECT DISTINCT vm_name FROM proxmox WHERE $__timeFilter(time) ORDER BY vm_nameThen filter panels with WHERE vm_name = '$vm_name'.
Alerting
Two alerts that are genuinely useful, both verified against live data.
Guest disk above 80%:
SELECT vm_name, MAX(disk_used_percentage) AS disk_percent
FROM proxmox
WHERE time >= NOW() - INTERVAL '5 minutes'
GROUP BY vm_name
HAVING MAX(disk_used_percentage) > 80
ORDER BY disk_percent DESC
Guest not running, which catches a VM that died or failed to come back after a reboot:
SELECT vm_name, vm_type
FROM (
  SELECT DISTINCT ON (vm_id) vm_id, vm_name, vm_type, status
  FROM proxmox
  WHERE time >= NOW() - INTERVAL '10 minutes'
  ORDER BY vm_id, time DESC
)
WHERE status <> 'running'
Both return rows only when something is wrong, which maps cleanly onto Grafana's alert model.
Building a Dashboard
The screenshot above is laid out like this, which works well with the data this plugin actually provides:
Row 1: Fleet Overview
- Stat: running guests, stopped guests, QEMU count, LXC count
- Stat: average fleet CPU and memory
Row 2: Resource Usage
- Time series: CPU % per guest
- Time series: Memory % per guest
Row 3: Guest Detail
- Bar gauge: disk used % per guest
- Table: top guests by CPU
- Table: guest status and uptime
Row 4: Node Metrics
- Time series: node CPU (from
inputs.cpu) - Table: node filesystem usage (from
inputs.disk)
Two panel settings are worth calling out, because both cost me a few minutes:
- The bar gauge needs Show → All values. Left on the default (Calculate), it reduces all your guests down to a single meaningless number.
- The time-series legends need enough panel height to list every guest. Grafana silently ellipsizes the overflow, so a guest can be plotted as a line but missing from the legend, which is easy to misread as missing data.
Filling the Gaps: Node and Storage Metrics
The Proxmox plugin covers guests only. For node-level and storage metrics you need Telegraf running on each Proxmox node with standard input plugins. Proxmox is Debian, so this is a normal Telegraf install:
[[inputs.cpu]]
  percpu = false
  totalcpu = true

[[inputs.mem]]
[[inputs.diskio]]
[[inputs.net]]

[[inputs.disk]]
  ignore_fs = ["tmpfs", "devtmpfs", "devfs", "iso9660", "overlay", "aufs", "squashfs"]

# ZFS pools, if you're using ZFS
[[inputs.zfs]]
  poolMetrics = true

[[outputs.arc]]
  url = "http://arc-host:8000/api/v1/write/msgpack"
  api_key = "${ARC_TOKEN}"
  database = "proxmox"
  content_encoding = "gzip"
That lands cpu, mem, disk, diskio, net, and zfs measurements alongside proxmox in the same database, so you can join guest metrics against the host they run on. The disk measurement is what gives you real storage-capacity alerting:
SELECT host, path, MAX(used_percent) AS used_percent
FROM disk
WHERE time >= NOW() - INTERVAL '5 minutes'
GROUP BY host, path
HAVING MAX(used_percent) > 85
A couple of quirks worth knowing:
- QEMU guests always report
swap_total = 0. Swap inside a VM is invisible to the hypervisor. LXC containers do report real swap, since the host manages it. - Stopped guests report zeros, not absent rows. That's why the queries above filter on
status = 'running'before averaging. Otherwise a stopped VM drags your fleet CPU average toward zero.
Why Arc for Proxmox Monitoring?
A few reasons I prefer Arc over other time-series databases for this:
-
Compression - Proxmox generates a lot of metrics. Arc's Parquet storage compresses efficiently, so months of data stays manageable.
-
Fast queries - When you need to analyze trends over weeks or months, Arc's DuckDB engine handles it without breaking a sweat.
-
SQL - No proprietary query language. Standard SQL means your Grafana dashboards are easy to build and maintain. Window functions like
DISTINCT ONare available, which is what makes the "latest state per guest" queries above so short. -
Portable data - Your metrics are stored in Parquet files. If you ever need to analyze them with Pandas, DuckDB CLI, or any other tool, you can.
Resources
- Telegraf Proxmox Plugin: github.com/influxdata/telegraf/tree/master/plugins/inputs/proxmox
- Telegraf Arc Output Plugin: docs.influxdata.com/telegraf/v1/output-plugins/arc
- Proxmox API Documentation: pve.proxmox.com/pve-docs/api-viewer
- Arc Documentation: docs.basekick.net/arc
- Grafana Arc Datasource: github.com/basekick-labs/grafana-arc-datasource