Why Context Matters: How Arc Shows You the Full Picture
Situation: You receive an alert that the CPU on one or more servers has spiked to 90%. You go to your favorite dashboard tool, acknowledge the alert, and check the graph to understand when the spike started. You also notice increased I/O and incoming traffic, so you want to dig deeper into what's going on.
Tool #1 - Logs: You open your logging tool and see a bunch of connection attempts, but purchases on your site are failing. You need to check logs from the frontend, database, and API.
Tool #2 - Traces: You open yet another tool to understand the traces. Is there a timeout somewhere? Between the frontend, API, or database?
Tool #3 - Metrics: After gathering information from these three places, you start to see a pattern. Your database connection pool is set too low, so it needs to wait for connections to be released before handling new orders—orders that flooded in from a marketing campaign.
Sound familiar? Having to jump between three or four tools just to understand what's happening? Me too. For a long time as a DevOps Engineer, I had to deal with situations exactly like this.
For me, from a very young age, I understood that context matters and sometimes it's everything.
And that's one of the reasons Arc is what it is. Not just a database to store metrics, but also logs, traces, and events—giving you context from a single place without jumping between tools.
How this works?
Arc stores all four types of observability data—metrics, logs, traces, and events—using the same columnar storage format (Parquet). While you typically organize them into separate databases (one per data type), Arc's DuckDB engine makes it trivial to query across all of them with standard SQL using cross-database joins.
One Endpoint, One Protocol
All four data types use the same MessagePack columnar protocol and hit the same endpoint:
POST /api/v1/write/msgpack
You just specify which database to write to via the X-Arc-Database header. In practice, you'd have:
production_metricsfor metrics dataproduction_logsfor log dataproduction_tracesfor distributed tracesproduction_eventsfor events data
Here's the performance Arc delivers:
- Metrics: 2.4M/sec - What is the state? (CPU, memory, request rate)
- Logs: 950K/sec - What is happening? (Application logs, errors)
- Traces: 940K/sec - How are requests flowing? (Distributed tracing spans)
- Events: 940K/sec - What changed? (Deployments, alerts, incidents)
The Magic: Cross-Database SQL Joins
Because everything uses the same storage engine (DuckDB) and has timestamps, you can correlate data across databases with simple SQL joins using database.table syntax. Let's see how to solve our opening scenario.
Solving the CPU Spike: A Real Example
Remember our scenario? CPU spike, failing purchases, connection pool issues. Here's how you'd investigate with Arc in one query instead of three tools:
Step 1: Find the Event That Triggered It
First, let's see what changed around the time of the CPU spike:
-- What events happened when CPU spiked?
WITH high_cpu_window AS (
    SELECT
        MIN(time) as window_start,
        MAX(time) as window_end
    FROM demo_metrics.system_metrics
    WHERE metric = 'cpu_usage'
        AND value > 80
        AND time > NOW() - INTERVAL '2 hours'
)
SELECT
    e.time,
    e.event_type,
    e.event_category,
    e.metadata
FROM demo_events.system_events e, high_cpu_window w
WHERE e.time BETWEEN w.window_start AND w.window_end
ORDER BY e.time DESC;
Result:
time                    | event_type                    | event_category   | metadata
------------------------+-------------------------------+------------------+--------------------------------------------------
2025-10-29 18:23:43.848 | alert_triggered               | infrastructure   | {"alert":"DatabaseConnectionPoolExhausted",...}
2025-10-29 18:18:43.848 | autoscale_triggered           | infrastructure   | {"from_replicas":3,"to_replicas":8,...}
2025-10-29 18:13:43.848 | marketing_campaign_started    | business         | {"campaign_name":"Black Friday 2024",...}
You see exactly what triggered the spike: a marketing campaign started, causing the system to autoscale, but connection pool still got exhausted.
Step 2: Check the Logs During That Time
Now let's see what errors were happening:
-- Show me errors during the campaign
WITH campaign_window AS (
    SELECT time as campaign_start, time + INTERVAL '30 minutes' as campaign_end
    FROM demo_events.system_events
    WHERE event_type = 'marketing_campaign_started'
        AND time > NOW() - INTERVAL '2 hours'
    LIMIT 1
)
SELECT
    c.campaign_start,
    l.time as log_time,
    l.level,
    l.message,
    l.service
FROM demo_logs.application_logs l, campaign_window c
WHERE l.level IN ('ERROR', 'FATAL')
    AND l.time BETWEEN c.campaign_start AND c.campaign_end
ORDER BY l.time DESC
LIMIT 100;
Result:
campaign_start          | log_time                | level | message                                  | service
------------------------+-------------------------+-------+------------------------------------------+------------------
2025-10-29 18:13:43.848 | 2025-10-29 18:43:43.488 | ERROR | Connection timeout to database           | order-service
2025-10-29 18:13:43.848 | 2025-10-29 18:43:32.688 | ERROR | Order processing failed: timeout         | user-service
2025-10-29 18:13:43.848 | 2025-10-29 18:43:16.488 | ERROR | Payment gateway timeout                  | database
2025-10-29 18:13:43.848 | 2025-10-29 18:43:06.768 | ERROR | Payment gateway timeout                  | user-service
2025-10-29 18:13:43.848 | 2025-10-29 18:42:41.928 | ERROR | Connection pool exhausted                | order-service
2025-10-29 18:13:43.848 | 2025-10-29 18:42:40.848 | ERROR | Connection timeout to database           | payment-service
2025-10-29 18:13:43.848 | 2025-10-29 18:42:35.448 | ERROR | Order processing failed: timeout         | api-gateway
2025-10-29 18:13:43.848 | 2025-10-29 18:42:31.128 | ERROR | Connection timeout to database           | inventory-service
2025-10-29 18:13:43.848 | 2025-10-29 18:42:18.168 | ERROR | Connection timeout to database           | database
2025-10-29 18:13:43.848 | 2025-10-29 18:41:54.408 | ERROR | Connection pool exhausted                | inventory-service
2025-10-29 18:13:43.848 | 2025-10-29 18:41:41.448 | ERROR | Connection timeout to database           | api-gateway
2025-10-29 18:13:43.848 | 2025-10-29 18:41:39.287 | ERROR | Failed to acquire database connection    | api-gateway
2025-10-29 18:13:43.848 | 2025-10-29 18:41:38.208 | ERROR | Connection timeout to database           | payment-service
2025-10-29 18:13:43.848 | 2025-10-29 18:41:27.408 | ERROR | Failed to acquire database connection    | api-gateway
2025-10-29 18:13:43.848 | 2025-10-29 18:41:07.968 | ERROR | Payment gateway timeout                  | database
2025-10-29 18:13:43.848 | 2025-10-29 18:41:00.408 | ERROR | Connection timeout to database           | api-gateway
...
You can see the pattern: connection timeouts, pool exhaustion, and cascading failures across multiple services.
Step 3: Trace the Slow Requests
Let's see which traces were affected:
-- How did latency change during the campaign?
WITH campaign_window AS (
    SELECT
        time as campaign_start,
        time + INTERVAL '30 minutes' as campaign_end
    FROM demo_events.system_events
    WHERE event_type = 'marketing_campaign_started'
        AND time > NOW() - INTERVAL '2 hours'
    LIMIT 1
)
SELECT
    CASE
        WHEN t.time < c.campaign_start THEN 'before_campaign'
        WHEN t.time BETWEEN c.campaign_start AND c.campaign_end THEN 'during_campaign'
        ELSE 'after_campaign'
    END as phase,
    COUNT(*) as request_count,
    AVG(t.duration_ns / 1000000.0) as avg_latency_ms,
    PERCENTILE_CONT(0.95) WITHIN GROUP (ORDER BY t.duration_ns / 1000000.0) as p95_latency_ms,
    SUM(CASE WHEN t.error = true THEN 1 ELSE 0 END) as error_count
FROM demo_traces.distributed_traces t, campaign_window c
WHERE t.service_name = 'api-gateway'
    AND t.time BETWEEN c.campaign_start - INTERVAL '30 minutes' AND c.campaign_end + INTERVAL '30 minutes'
GROUP BY phase
ORDER BY phase;
Result:
phase             | request_count | avg_latency_ms | p95_latency_ms | error_count
------------------+---------------+----------------+----------------+-------------
before_campaign   | 334           | 30.6          | 48.4           | 0
during_campaign   | 333           | 167.3         | 315.6          | 17
after_campaign    | 333           | 37.9          | 64.3           | 0
There's your root cause. During the campaign:
- Latency went up 5.5x (from 30ms to 167ms!)
- P95 latency went up 6.5x (from 48ms to 316ms)
- Errors spiked to 17 during campaign (5% error rate) vs 0 before/after
The Complete Picture: One Query to Rule Them All
Here's the power move—get everything in one query:
-- Complete context: metrics + logs + traces + events (cross-database join)
WITH campaign_window AS (
SELECT time, time + INTERVAL '30 minutes' as end_time
FROM demo_events.system_events
WHERE event_type = 'marketing_campaign_started'
AND time > NOW() - INTERVAL '2 hours'
LIMIT 1
)
SELECT
'Metrics' as data_type,
m.time,
m.host,
'CPU: ' || m.value::text as detail
FROM demo_metrics.system_metrics m, campaign_window c
WHERE m.metric = 'cpu_usage'
AND m.value > 80
AND m.time BETWEEN c.time AND c.end_time
UNION ALL
SELECT
'Logs' as data_type,
l.time,
l.service,
l.level || ': ' || l.message as detail
FROM demo_logs.application_logs l, campaign_window c
WHERE l.level IN ('ERROR', 'FATAL')
AND l.time BETWEEN c.time AND c.end_time
UNION ALL
SELECT
'Traces' as data_type,
t.time,
t.service_name,
'Latency: ' || (t.duration_ns / 1000000.0)::text || 'ms' as detail
FROM demo_traces.distributed_traces t, campaign_window c
WHERE t.duration_ns > 100000000 -- Slower than 100ms
AND t.time BETWEEN c.time AND c.end_time
UNION ALL
SELECT
'Events' as data_type,
e.time,
e.event_type,
e.event_category || ': ' || e.metadata as detail
FROM demo_events.system_events e, campaign_window c
WHERE e.time BETWEEN c.time AND c.end_time
ORDER BY time DESC
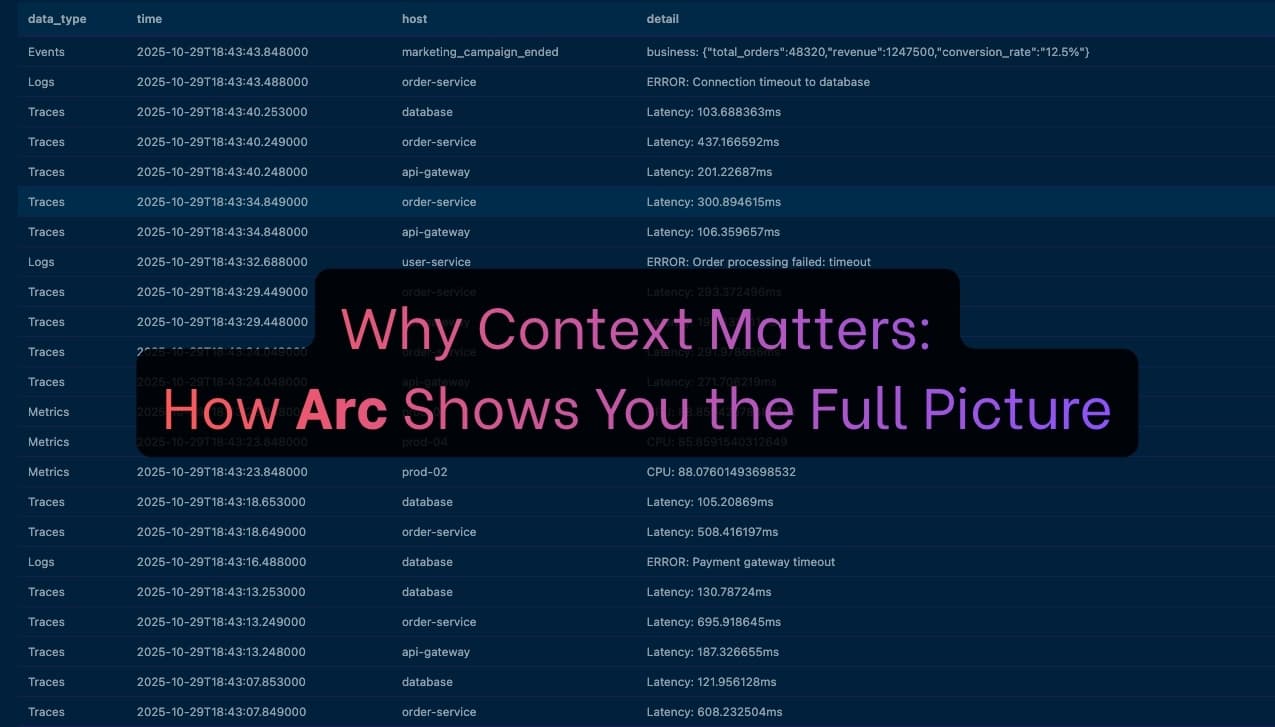
LIMIT 50;Result:
data_type | time                       | host/service          | detail
----------+----------------------------+-----------------------+------------------------------------------
Events    | 2025-10-29 18:13:43.848    | marketing_campaign... | business: {"campaign_name":"Black Friday...
Events    | 2025-10-29 18:18:43.848    | autoscale_triggered   | infrastructure: {"from_replicas":3,...}
Events    | 2025-10-29 18:23:43.848    | alert_triggered       | infrastructure: {"alert":"DatabaseConn...}
Metrics   | 2025-10-29 18:23:43.848    | prod-01               | CPU: 88.9
Metrics   | 2025-10-29 18:23:43.848    | prod-02               | CPU: 88.1
Logs      | 2025-10-29 18:24:35.448    | api-gateway           | ERROR: Order processing failed: timeout
Traces    | 2025-10-29 18:24:40.248    | api-gateway           | Latency: 201.2ms
Traces    | 2025-10-29 18:24:40.249    | order-service         | Latency: 437.2ms
Logs      | 2025-10-29 18:25:40.848    | payment-service       | ERROR: Connection timeout to database
Logs      | 2025-10-29 18:26:41.928    | order-service         | ERROR: Connection pool exhausted
Traces    | 2025-10-29 18:27:13.249    | order-service         | Latency: 695.9ms
Metrics   | 2025-10-29 18:28:03.848    | prod-02               | CPU: 92.3
Logs      | 2025-10-29 18:29:16.488    | database              | ERROR: Payment gateway timeout
Traces    | 2025-10-29 18:30:29.449    | order-service         | Latency: 293.4ms
Logs      | 2025-10-29 18:31:32.688    | user-service          | ERROR: Order processing failed: timeout
Metrics   | 2025-10-29 18:33:23.848    | prod-04               | CPU: 85.9
Traces    | 2025-10-29 18:35:40.253    | database              | Latency: 103.7ms
Logs      | 2025-10-29 18:37:43.488    | order-service         | ERROR: Connection timeout to database
...
This gives you a unified timeline showing exactly what happened across all your observability data.
Try It Yourself
Want to see this in action? We've created a unified demo scenario that generates the exact marketing campaign story described above—all four data types with perfectly correlated timestamps.
# Generate the complete marketing campaign scenario
./scripts/demo_scenario_marketing_campaign.py \
    --token YOUR_TOKEN \
    --database demo
This creates four separate databases (following real-world best practices):
demo_events- Campaign and alert eventsdemo_metrics- CPU and memory metricsdemo_logs- Application logsdemo_traces- Distributed traces
Data generated:
- 4 events: Campaign start/end, autoscaling, database alert
- 1,800 metric points: CPU and memory for 5 hosts over 1 hour
- 5,000 logs: Info, warnings, and errors with realistic distribution
- 3,000 trace spans: Showing latency degradation across services
Scenario timeline:
- T-30min: Baseline operations (20-30% CPU, 45ms avg latency, minimal errors)
- T=0: Marketing campaign starts →
marketing_campaign_startedevent - T+5min: Auto-scaling triggered →
autoscale_triggeredevent - T+10min: Database alert →
alert_triggeredevent - T+0 to T+30min: System under stress (75-95% CPU, connection timeouts, 3-8x higher latency)
- T+30min: Campaign ends →
marketing_campaign_endedevent - T+30 to T+60min: System recovers to normal
After running the script, you can immediately use the cross-database SQL queries from this post to investigate the incident and see how all four data types connect to tell the complete story. Arc's DuckDB engine makes cross-database joins seamless—just use database.table syntax!
Why This Matters
The traditional observability stack forces you to:
- Jump between tools (Prometheus, Loki, Jaeger, custom event stores)
- Export data to a separate system for correlation
- Lose context because timestamps don't quite line up
- Pay for multiple systems with different storage backends
- Learn multiple query languages (PromQL, LogQL, Jaeger UI, etc.)
Arc gives you:
- ✅ One database for everything
- ✅ One query language (SQL)
- ✅ Perfect timestamp alignment (all data in the same system)
- ✅ One storage backend (Parquet files)
- ✅ One protocol (MessagePack columnar)
Context isn't just nice to have—it's everything when you're troubleshooting production at 3 AM. Arc makes sure you have it.
Ready to Supercharge Your Observability?
Stop jumping between tools. Get the complete picture with Arc—metrics, logs, traces, and events in one high-performance database.
Try Arc for free: github.comBasekick-Labs/archttps://github.com/Basekick-Labs/arc