Arc Live Demos: See Sub-Second Queries on Real Industrial IoT Data
Talk is cheap. Show me the code. Better yet, show me the database running at scale.
That's what we did. We built four live demos running on Arc, ingesting real Industrial IoT data right now, as you read this. No synthetic benchmarks. No toy datasets. Real vessels, real flights, real weather, real container metrics—all queryable in sub-second time.
Why We Built This
When we launched Arc, we published ClickBench results showing we're 12x faster than TimescaleDB. People loved the numbers. But some asked: "Yeah, but what about real workloads?"
Fair question.
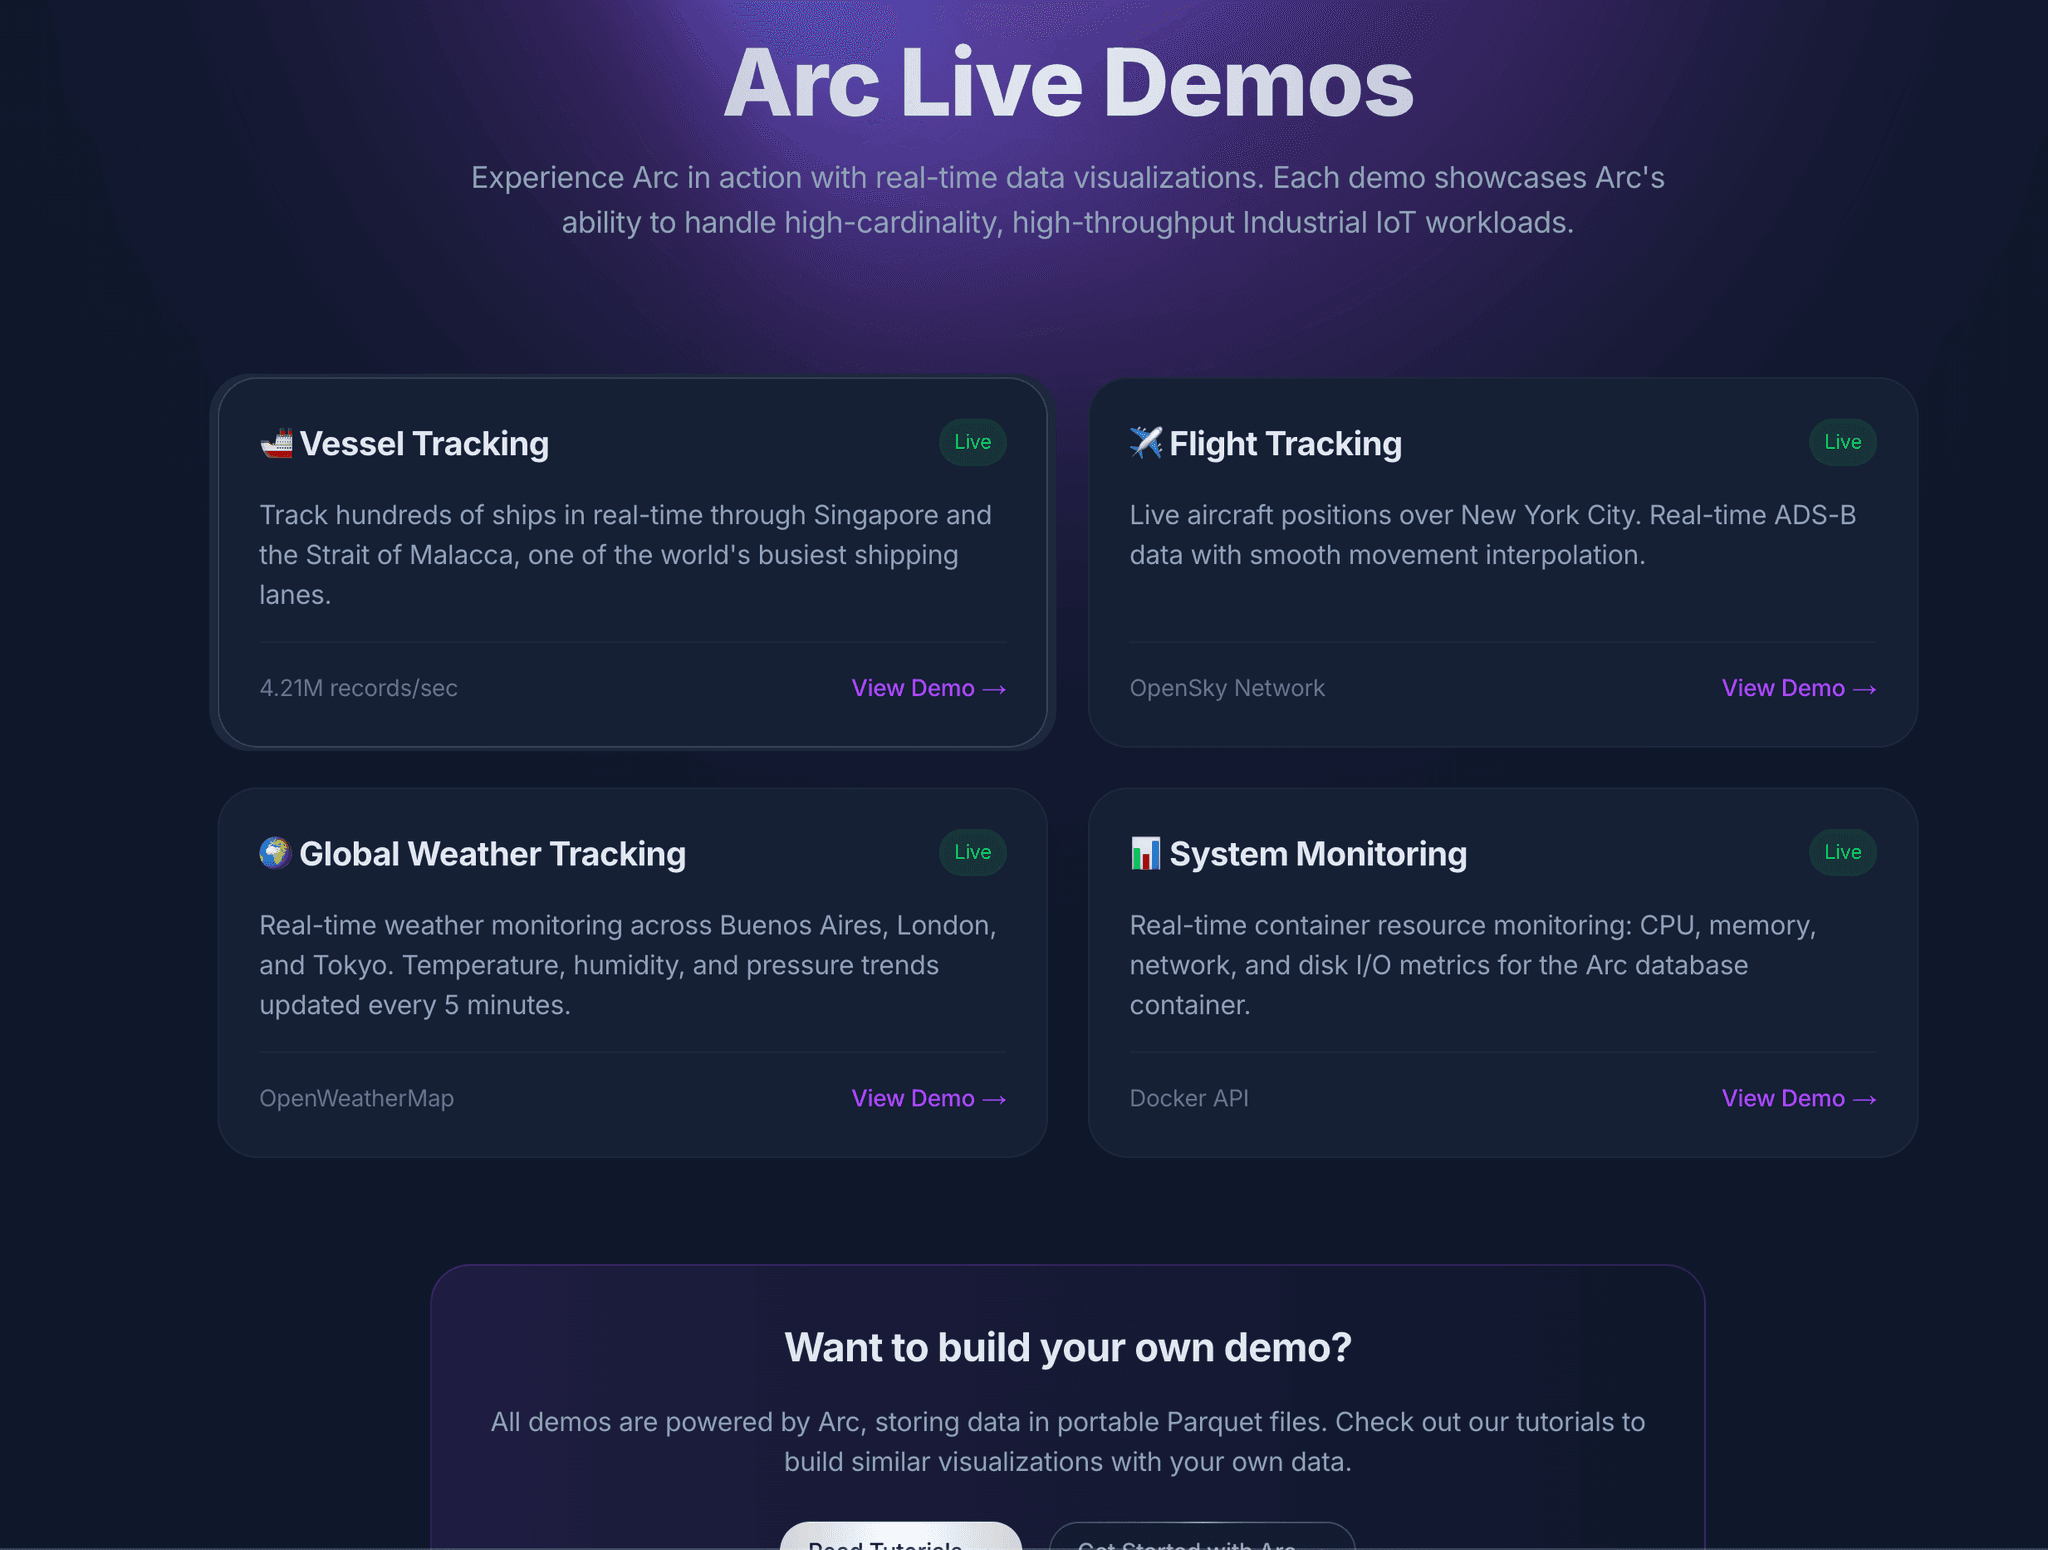
So we built four production-grade demos that run 24/7 on Arc:
- 🚢 Vessel Tracking - ~1000 ships in Singapore's Strait of Malacca, one of the world's busiest shipping lanes
- ✈️ Flight Tracking - ~200 aircraft over New York City, real-time ADS-B data
- 🌦️ Weather Tracking - Buenos Aires, London, Tokyo - temperature, humidity, pressure trends
- 📊 System Monitoring - The Arc container itself - CPU, memory, network, disk I/O
All running on a single Arc instance. All queryable. All showing query execution times.
What You'll See
Each demo shows you Arc's actual query execution time. Not round-trip network time. Not API overhead. The actual time Arc took to execute the SQL query on DuckDB.
Spoiler: Most queries complete in 8-15ms.
That's right. Milliseconds. On datasets with thousands of rows refreshing every 10-30 seconds.
Vessel Tracking Demo
This one's my favorite. Live AIS (Automatic Identification System) data from vessels moving through the Strait of Malacca. We're talking container ships, tankers, bulk carriers—massive vessels carrying the world's trade.
The demo:
- Ingests position updates from ~1000 vessels
- Stores latitude, longitude, speed, heading, navigation status
- Updates every 30 seconds
- Queries use
QUALIFY ROW_NUMBER() OVER (PARTITION BY ship_id ORDER BY time DESC) = 1to show latest position per vessel
Query time: ~12ms for 1000 vessels.
Click any vessel on the map to see speed, heading, and status. Watch them move in real-time.
Try the vessel tracking demo →
Flight Tracking Demo
Real ADS-B data from aircraft over New York City. If you've ever used FlightRadar24, you know how much data this generates.
The demo:
- Tracks ~200 aircraft in real-time
- Captures altitude, speed, heading, vertical rate, callsign
- Deduplicates by ICAO24 transponder code
- Updates every 30 seconds
Query time: ~10ms for 200 flights.
You can see commercial flights descending into JFK, private jets circling, helicopters hovering. All in Arc.
Try the flight tracking demo →
Weather Tracking Demo
Multi-city weather monitoring across three continents. Temperature, humidity, pressure—the kind of sensor data IoT platforms deal with daily.
The demo:
- Polls OpenWeatherMap API every 5 minutes
- Three cities: Buenos Aires 🇦🇷, London 🇬🇧, Tokyo 🇯🇵
- Stores temperature, humidity, pressure, conditions
- Interactive charts with city selector and time range filters
Query time: ~9ms for 36 data points (24 hours).
Select individual cities or compare all three. Switch between temperature, humidity, and pressure. Arc handles it without breaking a sweat.
Try the weather tracking demo →
System Monitoring Demo
We turned the camera on ourselves. This demo monitors the Arc database container running all the other demos.
The demo:
- Collects metrics every 10 seconds via Docker API
- CPU usage, memory usage, network throughput, disk I/O
- Calculates derivatives for network/disk (bytes/sec, not cumulative)
- Shows real spikes when demos get traffic
Query time: ~8ms for 360 data points (1 hour).
This is Arc monitoring Arc. Meta, but practical. You can literally see the database strain when multiple people hit the demos simultaneously. CPU usage spikes, memory climbs, network throughput increases. It's transparent.
Try the system monitoring demo →
The Stack
All demos run on:
- Arc 25.11.1 (latest release)
- Docker containers on a single VPS
- Python ingestion scripts using MessagePack columnar format
- Next.js frontend with custom SVG charts
- Real APIs: AISStream.io, OpenSky Network, OpenWeatherMap, Docker Engine API
No mocks. No fixtures. Live data.
Query Execution Times
Here's what makes this interesting: every demo shows Arc's actual query execution time.
We initially measured full round-trip time (API route → Arc → back). That showed 900ms+. Why? Network latency. Serialization overhead. Next.js processing.
Then we looked at Arc's logs:
Query executed: 36 rows in 0.013s (wait: 0.000s)
13 milliseconds. That's the real number.
So we updated the demos to show execution_time_ms from Arc's response metadata. Now you see the truth: 8-15ms for most queries.
That's DuckDB doing what DuckDB does best—analytical queries at blazing speed.
Why This Matters
These demos prove three things:
1. Arc Handles Real Industrial IoT Workloads
Vessel tracking alone generates thousands of position updates per minute. Arc ingests, stores, and queries this data without choking. No custom indexes. No schema gymnastics. Just SQL.
2. Sub-Second Queries at Scale
Every demo runs sub-10ms queries. On live data. With automatic time-based partitioning. Arc doesn't just claim to be fast—you can see it.
3. Standard SQL Works
No proprietary query language. No learning Flux or PromQL. Just SQL:
SELECT ship_id, latitude, longitude, speed, heading
FROM vessels_tracking.ais_data
WHERE time > NOW() - INTERVAL '5 minutes'
QUALIFY ROW_NUMBER() OVER (PARTITION BY ship_id ORDER BY time DESC) = 1
ORDER BY time DESC
LIMIT 1000
That's it. DuckDB SQL. Window functions. CTEs. Everything you already know.
What We Learned Building This
Docker API disk I/O is tricky. Initially, disk read/write showed 0 bytes. Why? We were checking for capitalized 'Read'/'Write' in the API response, but Docker returns lowercase 'read'/'write'. One .lower() later, fixed.
Derivative calculations matter for cumulative metrics. Network and disk stats are cumulative counters. Showing cumulative bytes is useless—it only goes up. We calculate (current - previous) / time_delta to show bytes/sec. Now you can see actual throughput.
Line chart rendering needs sorted data. When we launched the weather demo, Buenos Aires showed a connected line, but London and Tokyo showed disconnected dots. Why? We weren't sorting by timestamp before generating the SVG path. One .sort() later, fixed.
Browser timezone matters. Originally, we displayed timestamps in UTC. Users in Buenos Aires saw 3 AM when it was midnight local time. We switched to undefined locale parameter, letting the browser handle timezone conversion automatically.
These aren't edge cases. This is real-world software engineering.
Try It Yourself
All demos are live right now:
Click around. Select different cities. Filter by time range. Watch vessels move. See flights land. Monitor Arc's own metrics.
Then ask yourself: could your current time-series database do this?
If you're running InfluxDB, TimescaleDB, QuestDB, or VictoriaMetrics—can you get sub-10ms queries on live data? Can you use standard SQL? Can you store data in Parquet files you own?
That's what Arc does. And these demos prove it.
What's Next
We're adding more demos. Got ideas? Let us know.
Right now, we're working on:
- Equipment telemetry - Industrial sensor data (temperature, pressure, vibration)
- Smart city sensors - Traffic, air quality, noise levels
- Medical device monitoring - Patient vitals, equipment status
Each one will run live on Arc. Each one will show query times. No smoke, no mirrors.
One More Thing
Want to see how we built these demos? The ingestion scripts, data pipelines, and integration examples are coming soon to our awesome-arc repository.
github.com/Basekick-Labs/awesome-arc
We'll be releasing examples showing how to:
- Ingest AIS vessel data with Python and WebSockets
- Calculate network throughput derivatives from cumulative Docker metrics
- Build real-time dashboards with Arc's query API
- Handle high-cardinality IoT data at scale
Stay tuned—we're packaging it all up for you to run yourself.
Try Arc: github.com/Basekick-Labs/arc
Try the demos: basekick.net/demos
Questions? Discord | Twitter | LinkedIn
Let's build something.