Visualizing Arc Data with Grafana: From 70% to 40% CPU Usage

It's no secret that Grafana is one of the most powerful tools for observability. Personally, I love it and use it for monitoring Arc and other database instances. A few weeks ago, we started working on a Grafana data source plugin so you can use Arc with Grafana seamlessly.
In our case, we adapted a well-known dashboard to match our queries, and the results are great. Take a look.
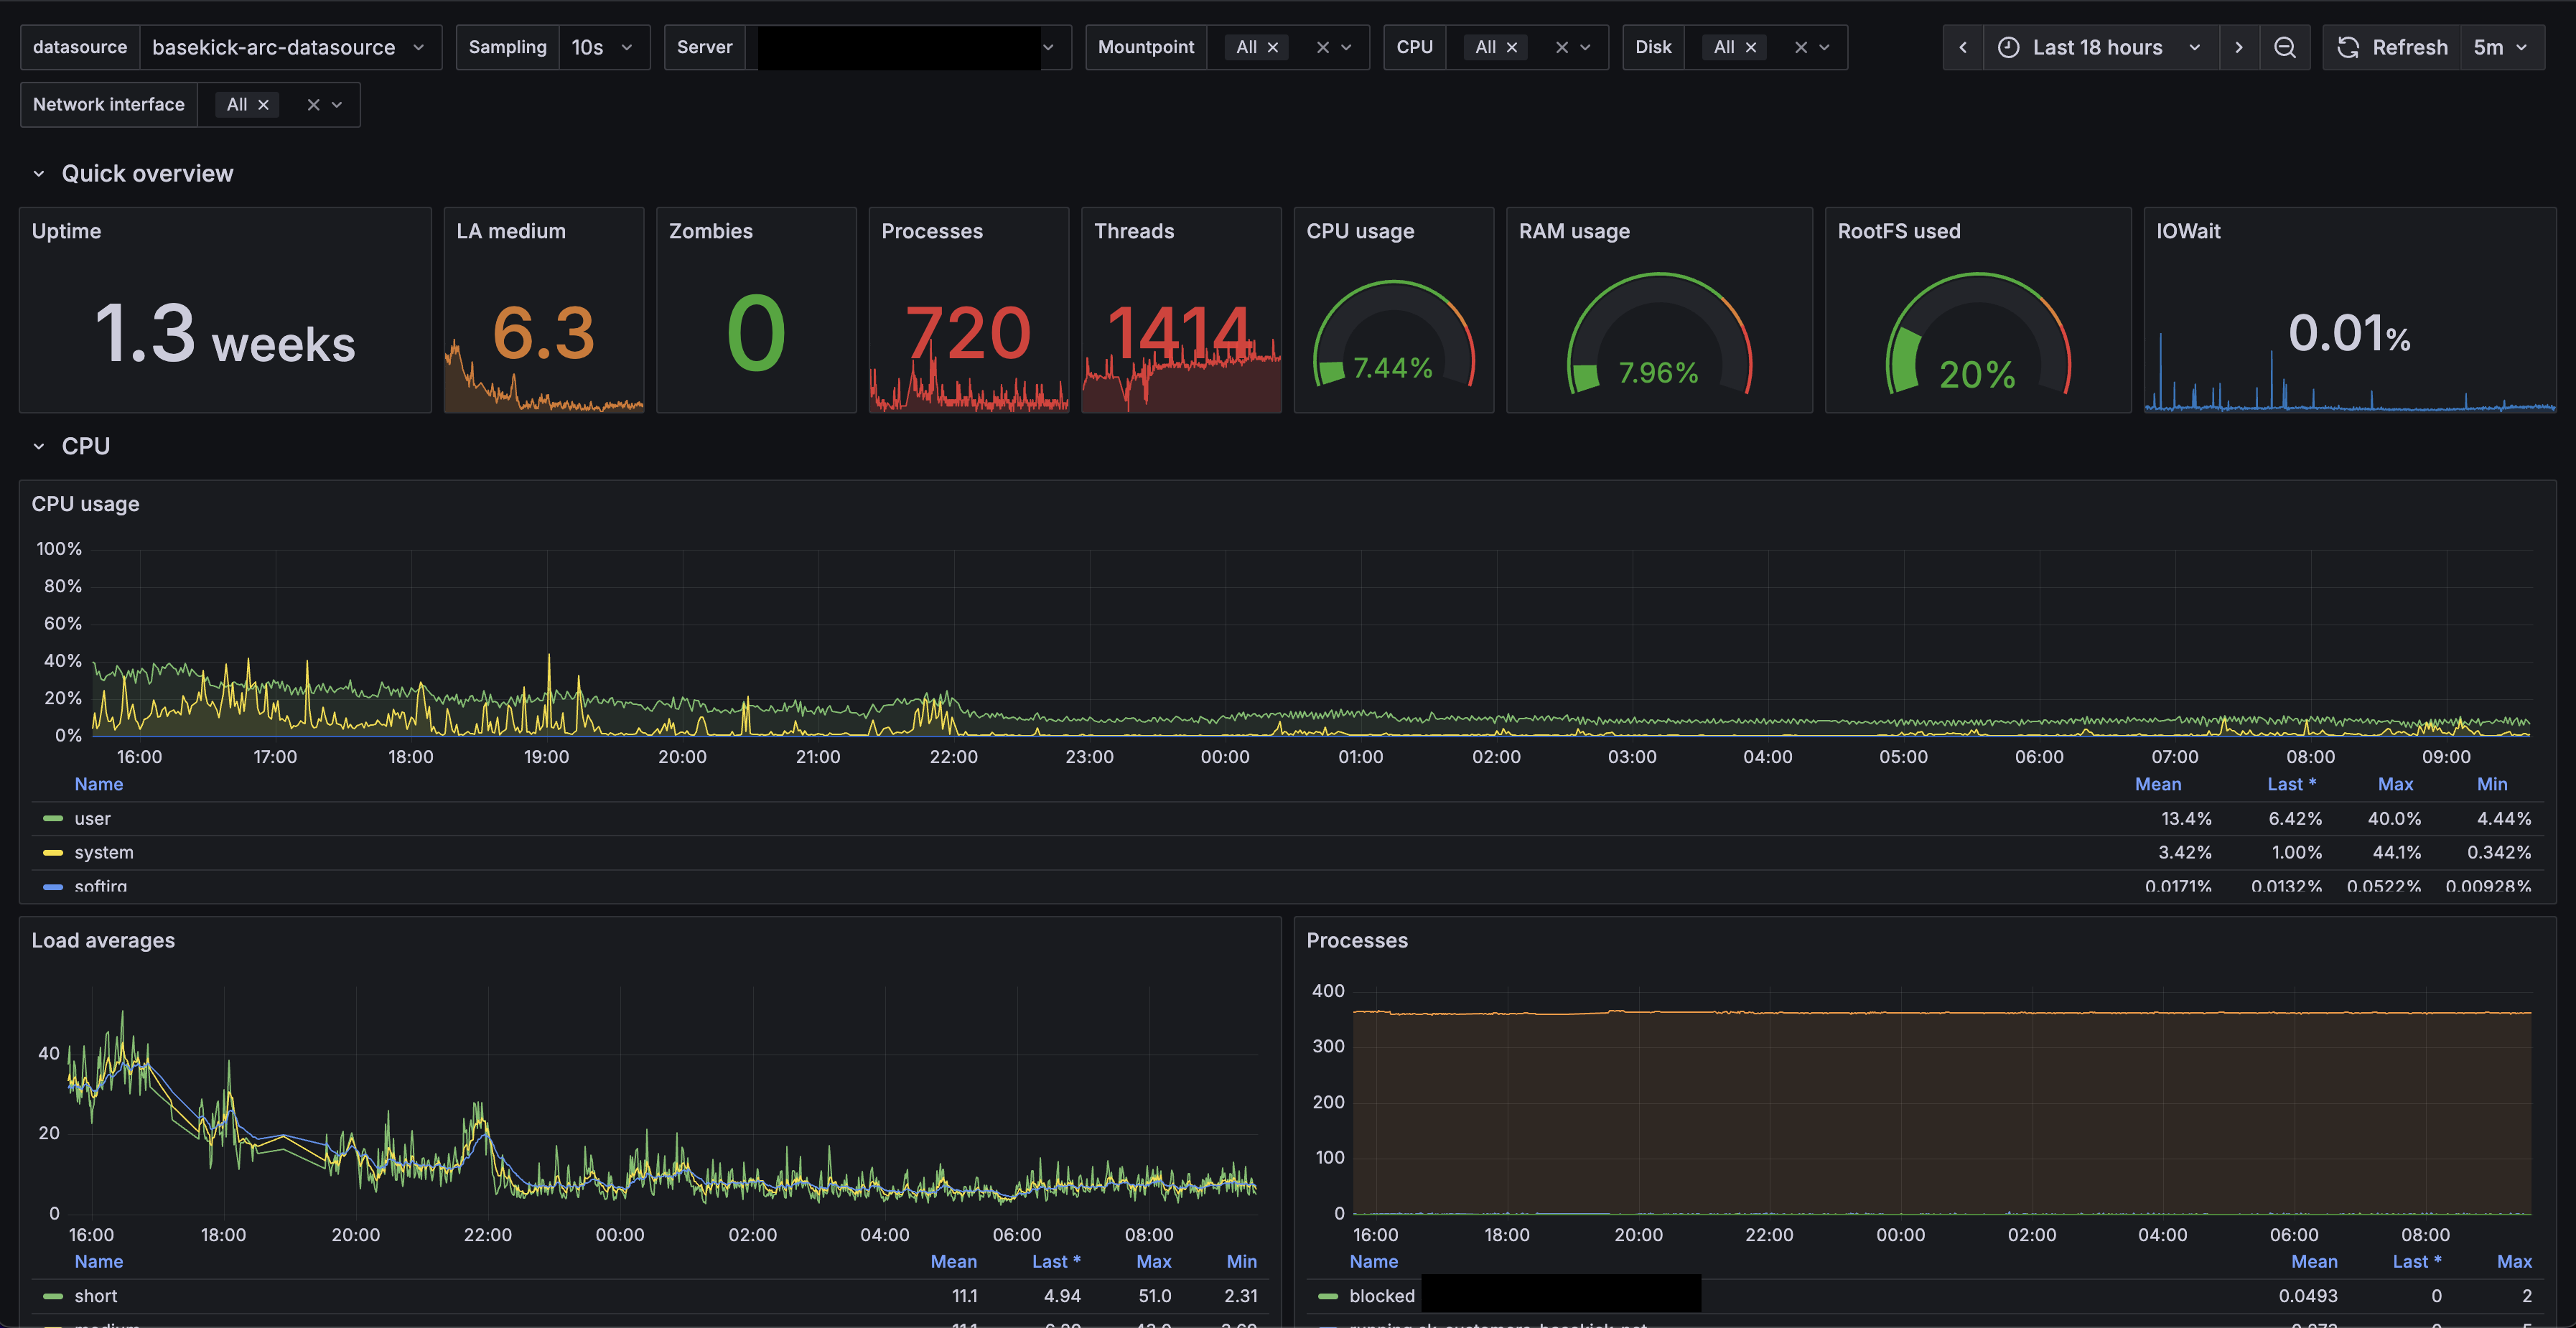
The server is chill, right? For this customer, we replaced InfluxDB with Arc, and CPU spikes went from 60-70% down to around 40%. Same story with memory—this customer used to have peaks of 95% memory usage. Right now, the baseline is 8% (on 256GB of RAM) and peaks around 95GB (40%).
This isn't just about lower resource usage—it's about cost savings and headroom for growth. Less CPU and memory means smaller instances, which means lower cloud bills. And with Arc's storage-compute separation, they can scale independently.
But we're not here just to talk about Arc's hardware utilization. We're here to talk about how to use Grafana with Arc.
Quick Start
Want to jump right in? Here's the TL;DR:
- Install the plugin from our GitHub repo
- Add Arc as a data source in Grafana
- Start querying with standard SQL and time-series macros
- Use Grafana's
$__timeFilter()macro for time filtering
The rest of this article walks through everything in detail.
Getting started
To get started, head over to the Grafana Arc Datasource repo. Feel free to look around, open issues if you find any, or contribute—contributions are more than welcome!
The installation is quite easy and can be summarized in a few commands:
# Clone repository
git clone https://github.com/basekick-labs/grafana-arc-datasource
cd grafana-arc-datasource

# Install dependencies
npm install

# Build plugin
npm run build

# Build backend
mage -v

# Install to Grafana
cp -r dist /var/lib/grafana/plugins/grafana-arc-datasource
systemctl restart grafana-server
Configuration
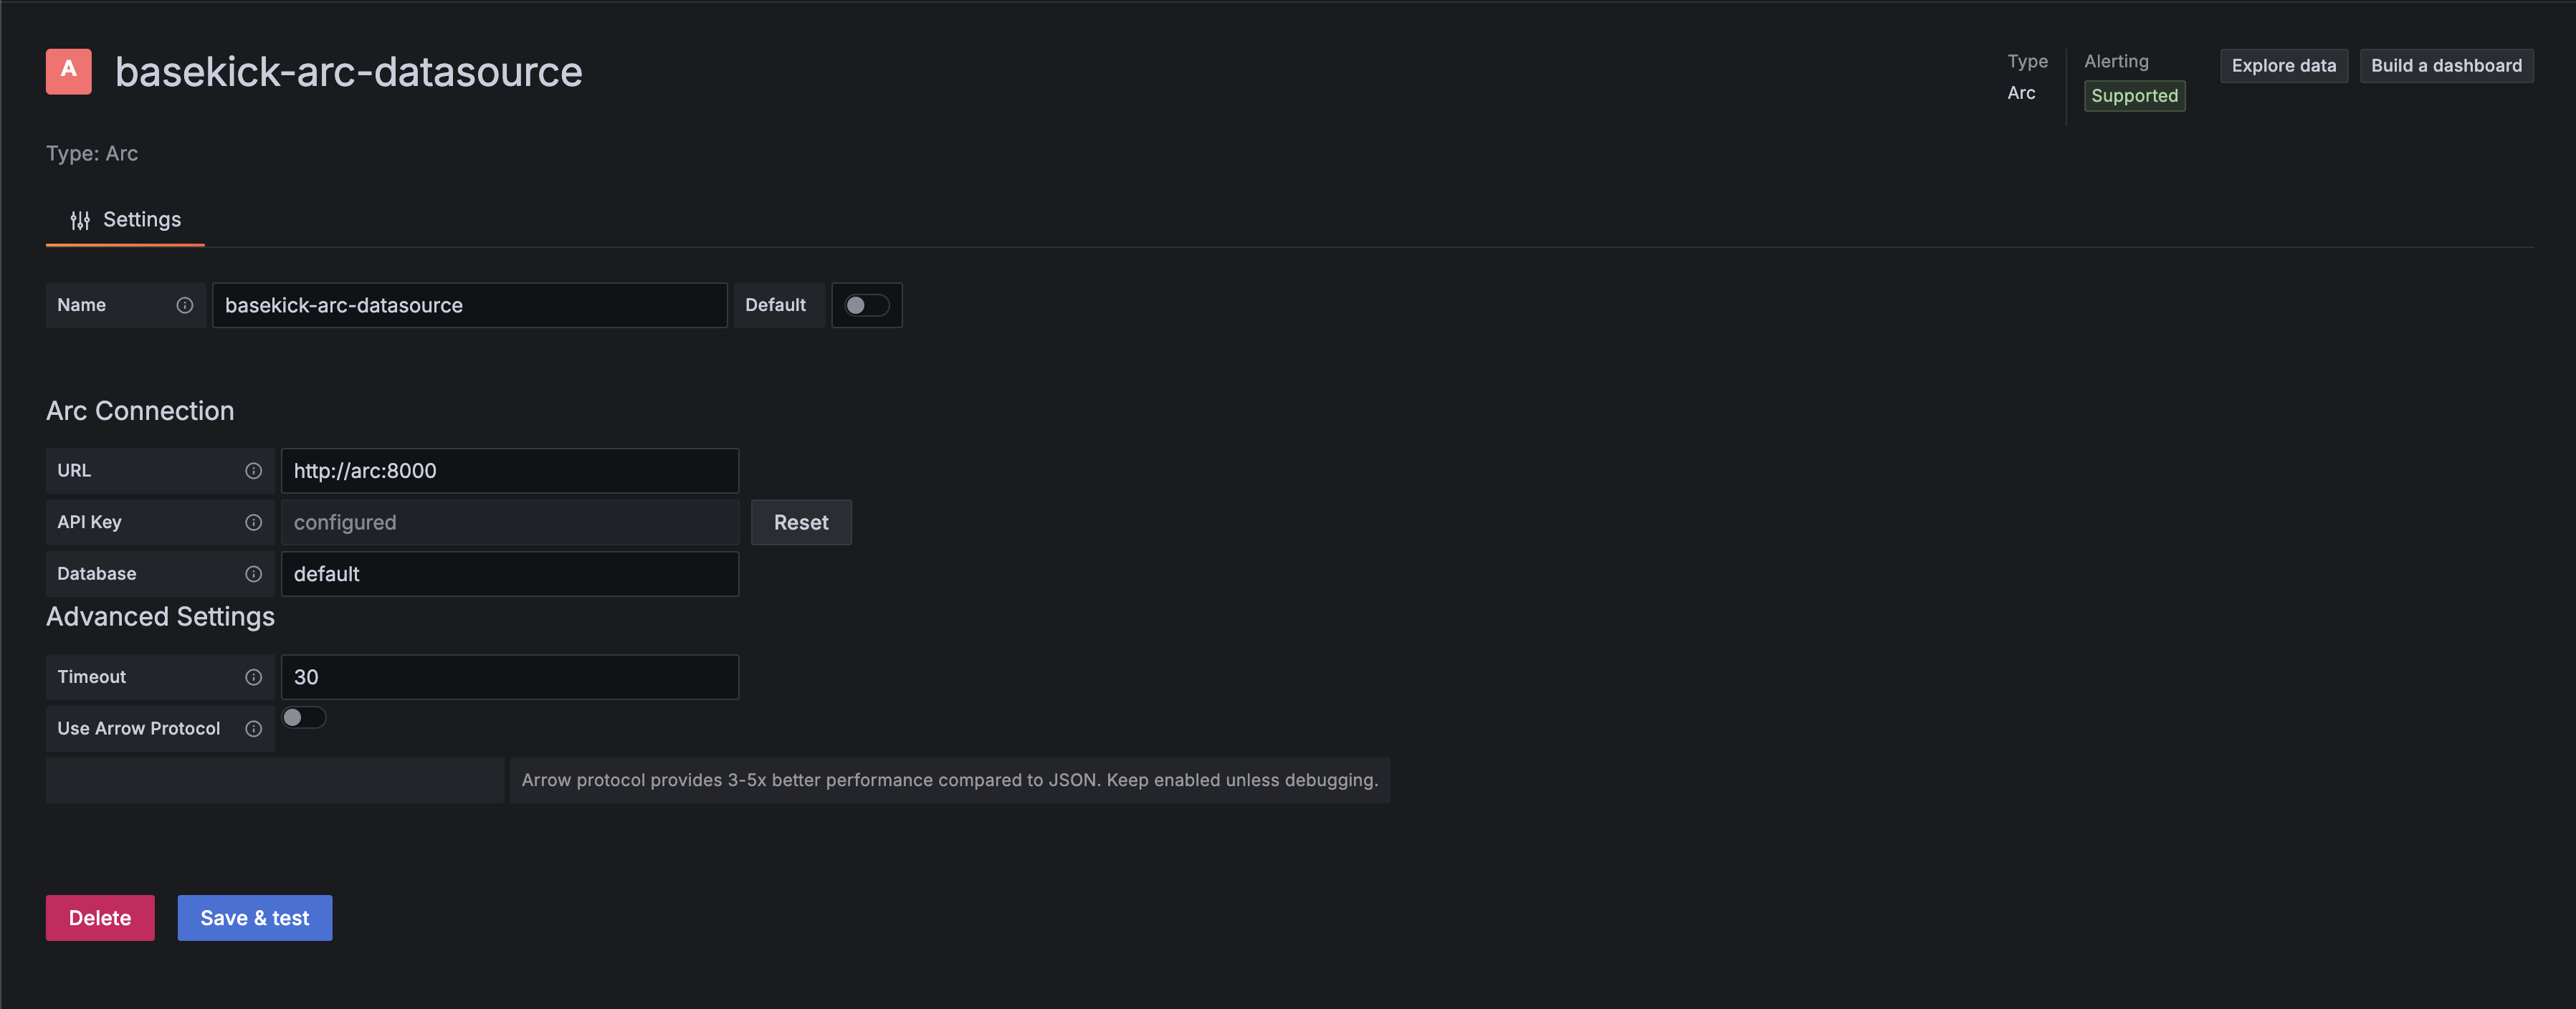
In Grafana, follow these steps to add Arc as a data source:
- Go to Configuration → Data sources
- Click Add data source
- Search for and select Arc
- Configure connection settings:
- URL: Arc API endpoint (e.g.,
http://localhost:8000) - API Key: Your Arc authentication token
- Database (optional): Default database/schema
- URL: Arc API endpoint (e.g.,
- Click Save & Test
Configuration Options
| Option | Description | Required | Default |
|---|---|---|---|
| URL | Arc API base URL | Yes | - |
| API Key | Authentication token | Yes | - |
| Database | Default database name | No | default |
| Timeout | Query timeout in seconds | No | 30 |
| Use Arrow | Enable Arrow protocol | No | true (recommended) |
Usage
Query Editor
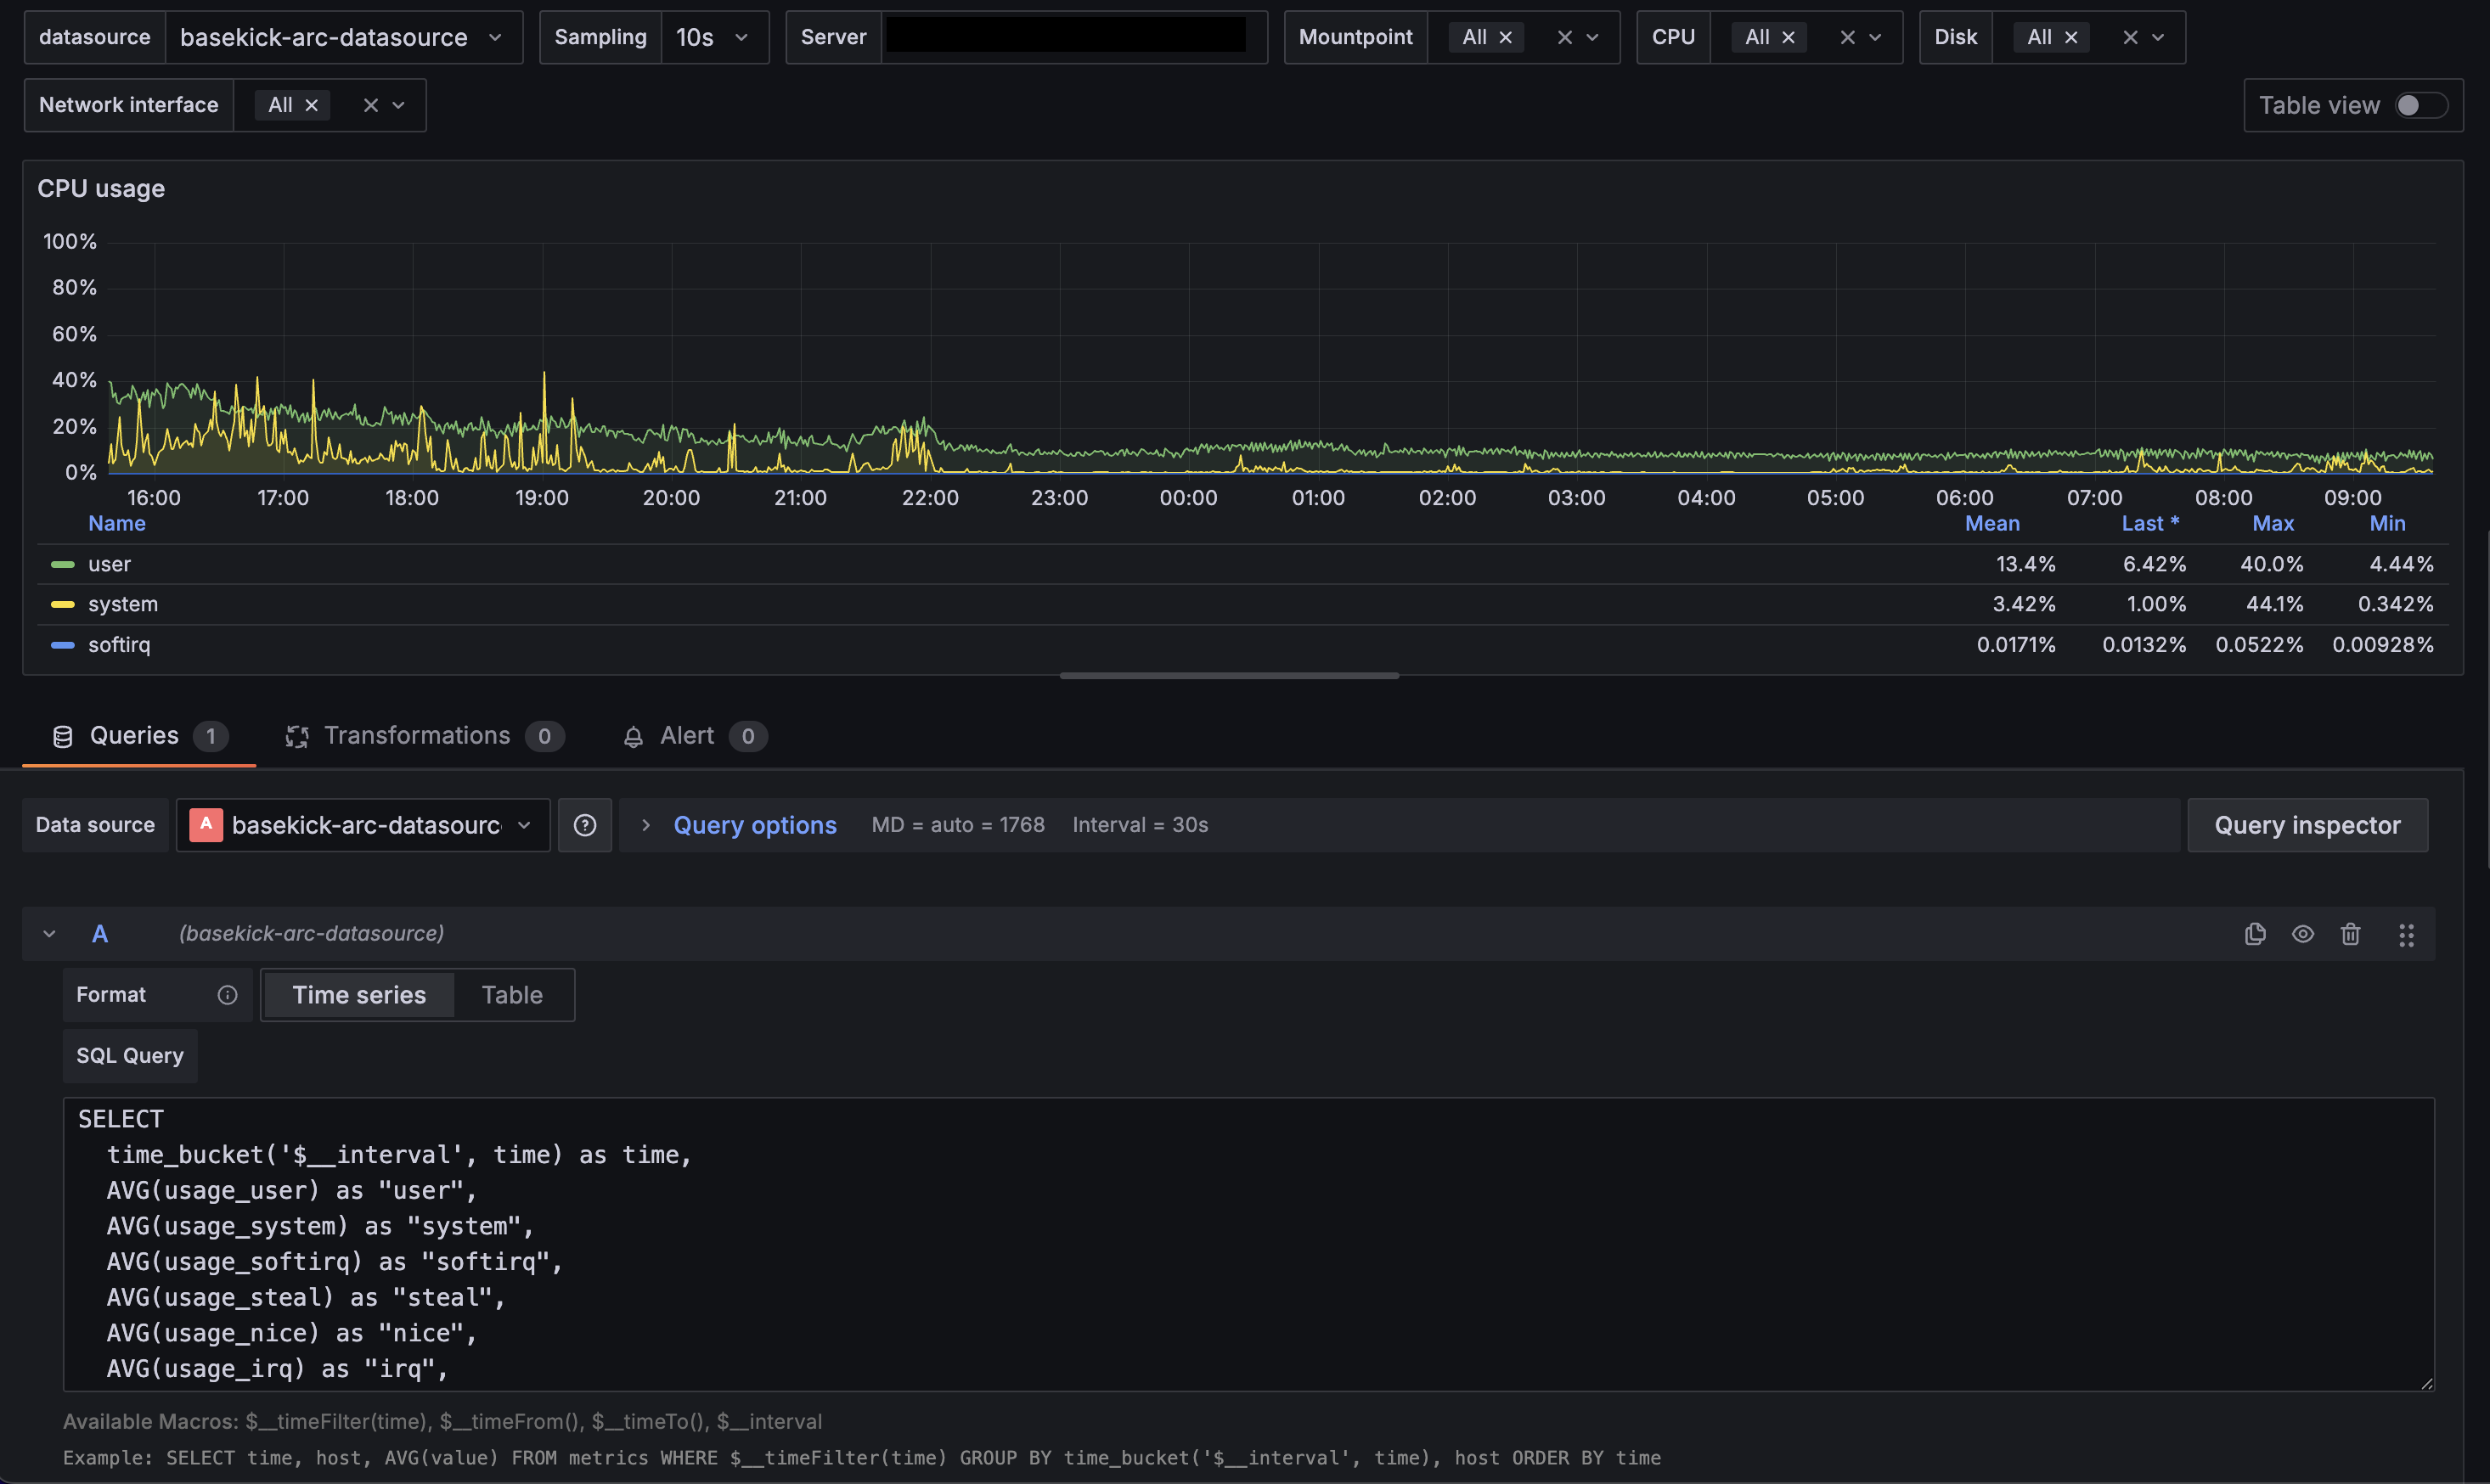
The Arc datasource provides a SQL query editor with:
- Syntax highlighting
- Auto-completion for tables and columns
- Time range macros
Example Queries
Basic time-series query (CPU usage):
SELECT
  time_bucket(INTERVAL '$__interval', time) as time,
  AVG(usage_idle) * -1 + 100 AS cpu_usage,
  host
FROM telegraf.cpu
WHERE cpu = 'cpu-total'
  AND $__timeFilter(time)
GROUP BY time_bucket(INTERVAL '$__interval', time), host
ORDER BY time ASC
Memory usage:
SELECT
  time_bucket(INTERVAL '$__interval', time) as time,
  AVG(used_percent) AS memory_used,
  host
FROM telegraf.mem
WHERE $__timeFilter(time)
GROUP BY time_bucket(INTERVAL '$__interval', time), host
ORDER BY time ASC
Network traffic (bytes to bits):
SELECT
  time_bucket(INTERVAL '$__interval', time) as time,
  AVG(bytes_recv) * 8 AS bits_in,
  host,
  interface
FROM telegraf.net
WHERE $__timeFilter(time)
GROUP BY time_bucket(INTERVAL '$__interval', time), host, interface
ORDER BY time ASC
Macros
The datasource provides several macros for dynamic queries:
| Macro | Description | Example |
|---|---|---|
$__timeFilter(columnName) | Complete time range filter | WHERE $__timeFilter(time) |
$__timeFrom() | Start of time range | time >= $__timeFrom() |
$__timeTo() | End of time range | time < $__timeTo() |
$__interval | Grafana's calculated interval | time_bucket(INTERVAL '$__interval', time) |
Variables
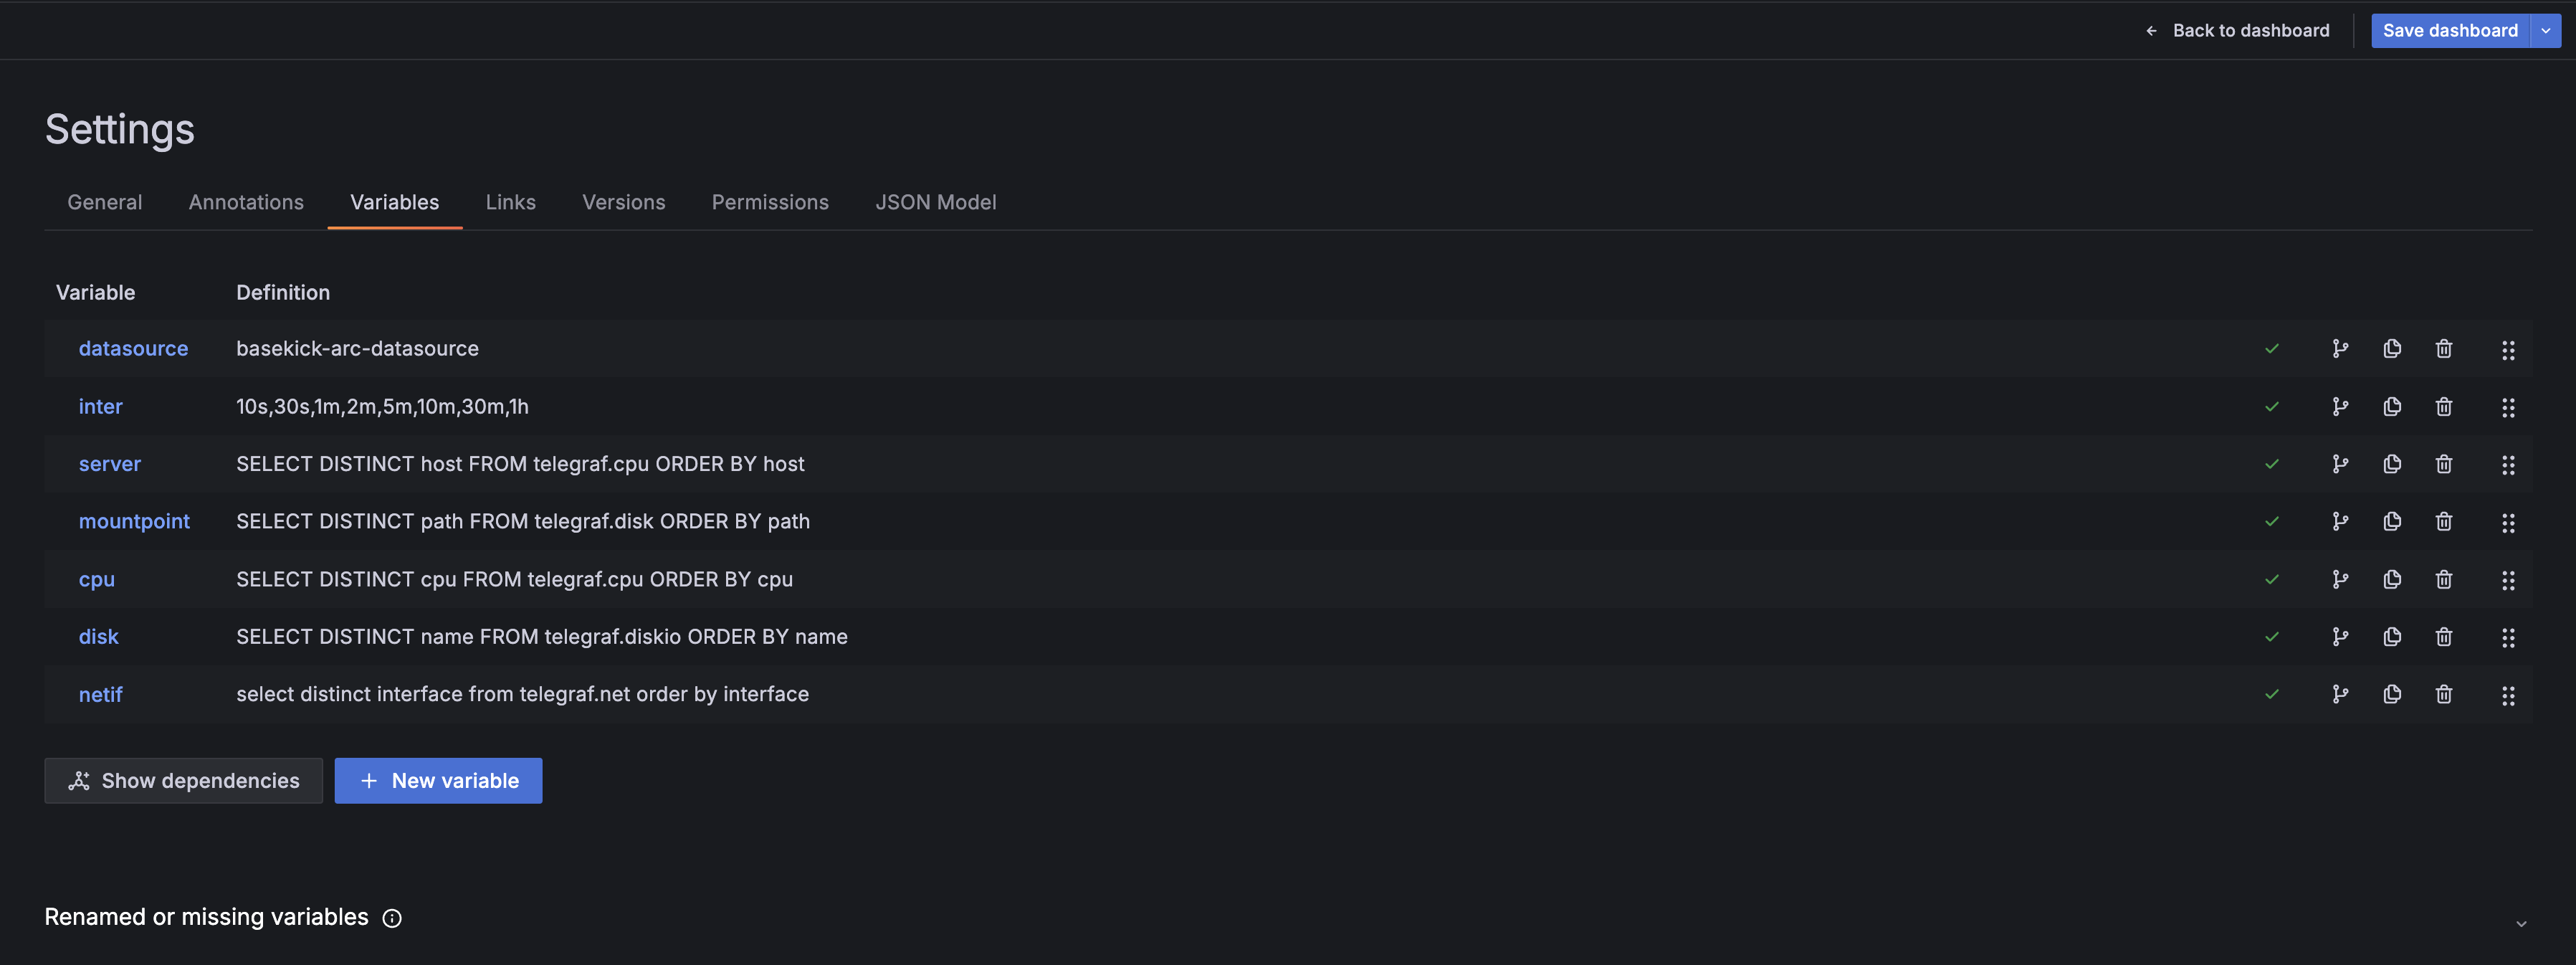
Create dashboard variables to make queries dynamic:
Host variable:
SELECT DISTINCT host FROM telegraf.cpu ORDER BY hostInterface variable:
SELECT DISTINCT interface FROM telegraf.net ORDER BY interfaceUse variables in queries with $variable syntax:
SELECT
  time_bucket(INTERVAL '$__interval', time) as time,
  AVG(usage_idle) * -1 + 100 AS cpu_usage
FROM telegraf.cpu
WHERE host = '$server'
  AND cpu = 'cpu-total'
  AND $__timeFilter(time)
GROUP BY time_bucket(INTERVAL '$__interval', time)
ORDER BY time ASC
Performance Tips
Use Arrow protocol: Arrow is enabled by default and provides significantly faster data transfer compared to JSON. Keep it enabled unless you have specific compatibility requirements.
Optimize time ranges: Smaller time ranges mean faster queries. Use Grafana's time picker to narrow down your analysis.
Leverage time_bucket: Use appropriate intervals in time_bucket() to avoid returning millions of points. Grafana will automatically adjust $__interval based on your dashboard width.
Index your time column: Arc automatically indexes time columns, but ensure your queries filter by time first for optimal performance.
Alerting
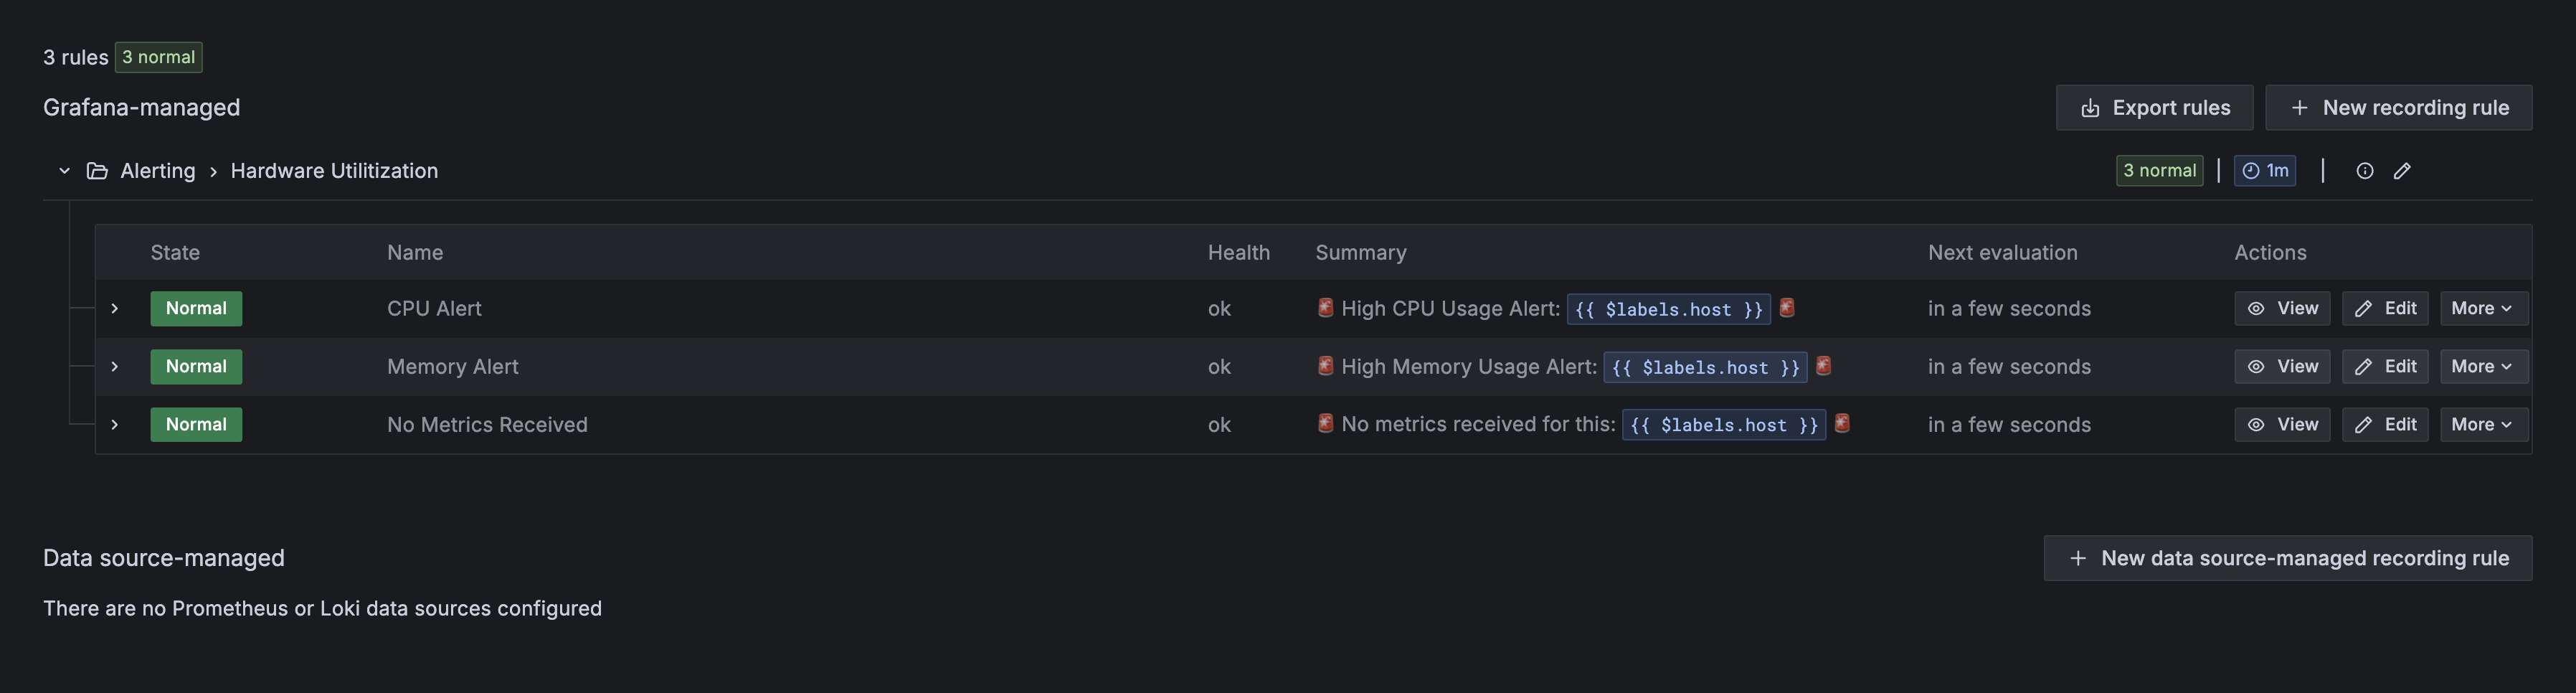
The datasource fully supports Grafana alerting. Create alert rules with Arc queries:
Example alert query (CPU usage > 80%):
SELECT
  time,
  100 - usage_idle AS cpu_usage,
  host
FROM telegraf.cpu
WHERE cpu = 'cpu-total'
  AND time >= NOW() - INTERVAL '5 minutes'
ORDER BY time ASC
Then set alert condition: WHEN avg() OF query(A, 5m, now) IS ABOVE 80
Troubleshooting
Plugin not showing up in Grafana?
- Make sure you restart Grafana after copying the plugin:
systemctl restart grafana-server - Check Grafana logs for any plugin loading errors:
journalctl -u grafana-server -f
Connection test failing?
- Verify Arc is running and accessible at the URL you configured
- Check that your API key is valid
- Ensure the Arc API endpoint includes the protocol (http:// or https://)
Queries returning no data?
- Verify your time column is a timestamp type
- Check that the time range includes data in your database
- Use
$__timeFilter(time)for proper time filtering
What's next?
The Arc Grafana datasource is actively developed and we're always looking for feedback. If you run into issues or have feature requests, please open an issue on GitHub.
Coming soon:
- Dashboard templates for common monitoring scenarios
- Additional macros for complex time-series queries
- Enhanced Arrow protocol support for even faster query performance
Want to learn more about Arc? Check out our documentation or join the conversation on GitHub.